stem and leaf plot
Histograms
Shape of distribution
Vocabulary
Drawing
100
what is the highest number?
What is the lowest number?

highest number: 56
lowest number: 20
100
what is the biggest frequecy? What is the smallest frequency?
biggest: 20
smallest: 1
100
Where are the gaps in this graph?
a data point on number 6 and 8
100
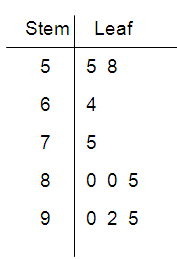
What does the stem and leaf plot mean?
organize numbers by place value. stem is for first digit and leaf is for the second digit
100
Take the data that is in the stem and leaf plot and put them in order from smallest to biggest.
stem leaf
0 2, 4, 8, 9
1 0, 3, 5
2 1, 2, 6,6,8,8
3 7, 7, 7, 9
2 4 8 9 10 13 15 21 22 26 26 28 28 37 37 37 39
200
What is the range?
40
200

How many students did they measure for height?
35 students
200
What is missing in this graph?
more data is missing, also on 1.7
200
What are peaks?
tallest part of the graph where most data is located
200
Make a stem and leaf plot using these numbers.
56 83 70 35 91 52 34 87 90 104
stem leaf
3 4, 5
5 2, 6
7 0
8 3, 7
9 0, 1
10 4
300
Fill in the blank. 15, 19, 23, 26, 28, 31, 34
stem leaf
1 5, __
2 __, 6, 8
__ 1, 4
9
3
3
300
How many numbers are in the group 10-20? How many are in 21-30?
5, 8, 11, 13, 15, 22, 24, 26, 28, 29, 31, 33, 35
3
5
300
What shape is this graph?
skewed right, skewed left, symmetrical

Skewed left
300
What is an outlier?
data that is much higher or much lower than the rest
300
Use these numbers to make a histogram. (Label graph by 10s)
8, 12, 15, 18, 21, 23, 25, 26, 31, 35, 38, 42, 45
Frequency
4 | █
3 | █ █ █
2 | █ █ █ █
1 | █ █ █ █ █
0 +----------------------------------
0–9 10–19 20–29 30–39 40–49
400
Is there a gap in this plot?
stem leaf
0 3,5,7,7, 7,8,9
1
2 0, 1, 6, 8
3 2, 4, 9
yes, the data point 1
400
what is the mode of this group of numbers on the graph?:max_bytes(150000):strip_icc()/Histogram1-92513160f945482e95c1afc81cb5901e.png)
41-50
400
What shape is this graph?
Skewed left, skewed right, symmetrical
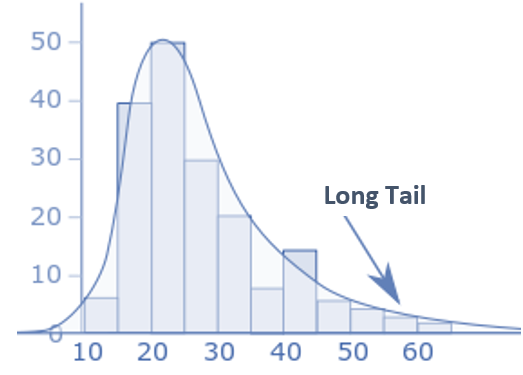
skewed right
400
What do histograms show you?
Histograms show continuous data
400
Draw a dot plot using these numbers.
10, 11, 12, 20, 21, 22, 30, 31, 32, 40, 52, 10, 22, 40, 10, 12, 10
4 | ●
3 | ●
2 | ● ● ● ●
1 | ● ● ● ● ● ● ● ● ● ● ●
--------------------------------------------------
10 11 12 20 21 22 30 31 32 40 52
500
what is the mean, median, and mode of this graph?

mean: 27.4
median: 24
mode: 22 and 25
500
what are the percentages of each interval?

0-3: 18%
3-6: 30%
6-10: 25%
10-20: 18%
20-30: 10%
30+: 5%
500
Explain what you see in this graph.

it is symmetrical, there is a cluster of data points, there are more data on the low numbers
500
What is the difference between a histogram and a bar graph?
bar graphs don't touch, Histograms are together
500
Draw a skewed right dot plot, but add an outlier.
Use any numbers you want.