Box Plots
Dot Plots
Measures of Center
100
The median of this box plot
What is 32?
100
The number of games the teams played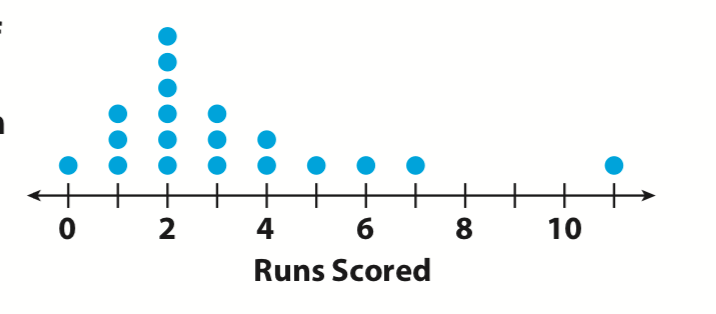
What is 19?
100
The average of a set of data found by adding all data values and dividing by the number of data values
What is mean?
200
The lower quartile of this box plot
What is 26?
200
The number of games in which the team scored 1 run or fewer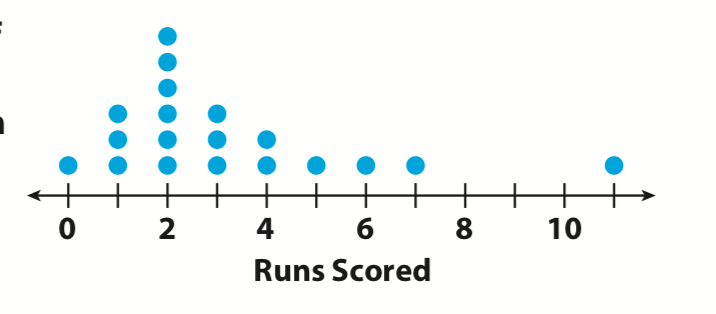
What is 4?
200
The middle number of a set of ordered numbers
What is median?
300
The upper quartile of this box plot
What is 54?
300
The mode of this box plot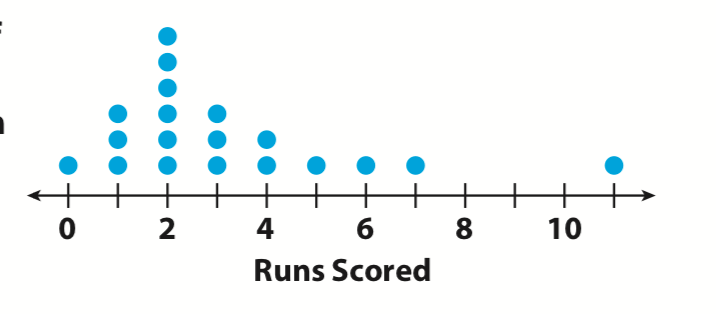
What is 2?
300
The number that occurs the most frequently in a set of data values
What is mode?
400
The range of this box plot
What is 38?
400
The outlier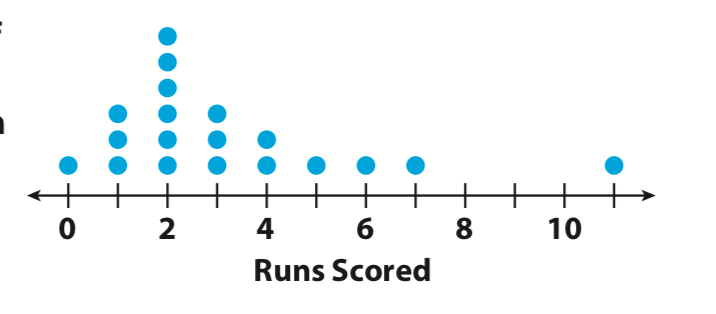
What is 11?
400
The difference between the highest value and lowest value in a data set
What is range?
500
The percent of actors that are 32 or younger
What is 50%?
500
The range of this dot plot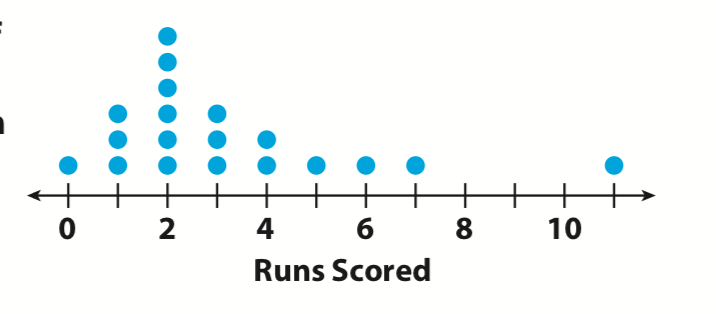
What is 11?
500
A data value that is either much greater or much less than other data values
What is an outlier?