Mean Median Mode, Oh My!!!
Histograms
Box and Whisker Plot
Stem and Leaf and Dot Plots
Vocabulary
100
Find the mode of this data...
0 , 1 , 2 , 3, 4, 5, 6, 7, 8, 9, 10
no mode
100
What are the range of numbers called that go along the bottom of a histogram?
What are the intervals?
100
What five things do you need to create a box and whisker plot?
Min, Max, Q1, Q3, Median
100
When finding the number of data points using a stem and leaf plot, do you count the stems or the leaves?
The leaves
100
In a data set, what number appears most often?
What is the mode?
200
Find the median of the data...
14, 12, 10, 15, 18, 23, 19, 16
15.5
200
What goes along the side of a histogram?
What is the frequency?
200
What forms the whiskers of a box and whisker plot?
The whiskers are connections of the min and max to the box (quartiles).
200
Each dot/x on a dot/line plot represents what?
A single piece of data.
200
In a data set, what number is in the middle?
What is the median?
300
Potent Potable: What is the hottest planet?
Venus
300
True or False: The range for each interval on a histogram must be the same.
True - they need to be consistent!
300
POTENT POTABLE:
What holiday falls on March 17th each year?
St. Patrick's Day
300
POTENT POTABLE:
How many legs does a crab have?
Ten
300
In a data set, what number represents the "average?"
What is the mean?
400
What is the mode for the following data set: 30, 37, 33, 32, 38, 36, 27, 2, 34, 32
32
400
POTENT POTABLE:
In Toy Story, who owns Woody and Buzz?
Andy
400
What is the lower median of a box and whisker data set called?
What is the lower quartile?
400
What is the median of the dot plot shown below? 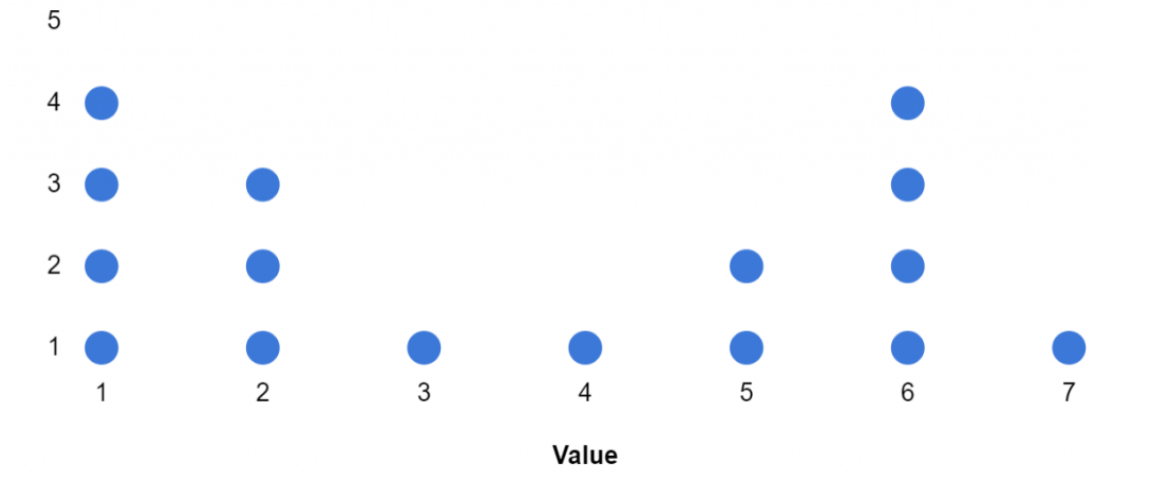
3.5
400
In a data set, what number tells you the difference between the highest number and lowest number?
What is the range?
500
Find the mean of the data...to the nearest tenth.
2, 10, 24, 6, 10, 12, 14, 18, 28
13.8
500
Make a frequency table with the following data set. Use intervals of 3.
1,12,4,2,3,5,7,2,8,3,4,2,11
1-3: 6
4-6: 3
7-9: 2
10-12: 2
500
Create a box and whisker plot out of the data: 2, 8, 5, 6, 12, 15, 3, 10, 4, 14, 20, 0
Smallest Value = 0 Greatest Value = 20 Median = 7 Lower Quartile = 3.5 Upper Quartile = 13
500
What is the mean of the data shown on the stem and leaf plot below? Round to the nearest whole number.
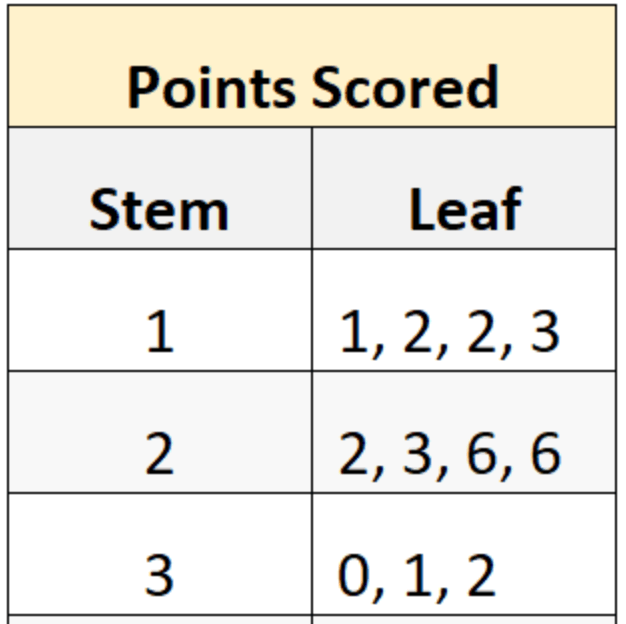
22
500
POTENT POTABLE:
What are the names of the seven dwarves from Snow White?
Sleepy, sneezy, happy, grumpy, dopey, bashful and doc