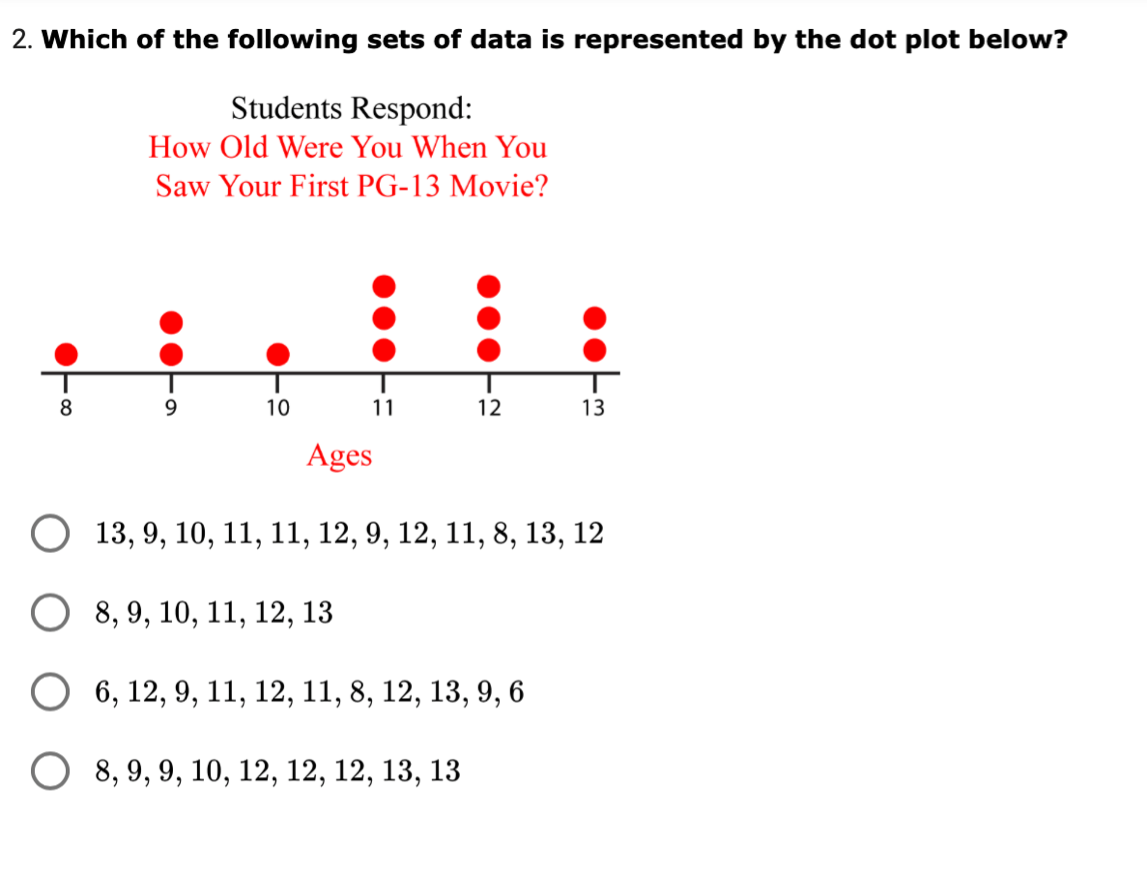
Dot Plots
Frequency Table
Histogram
Box Plot
Mean, Median, Mode, Range
100
Which number has the highest frequency and what is the skew?
1 and skewed right
100
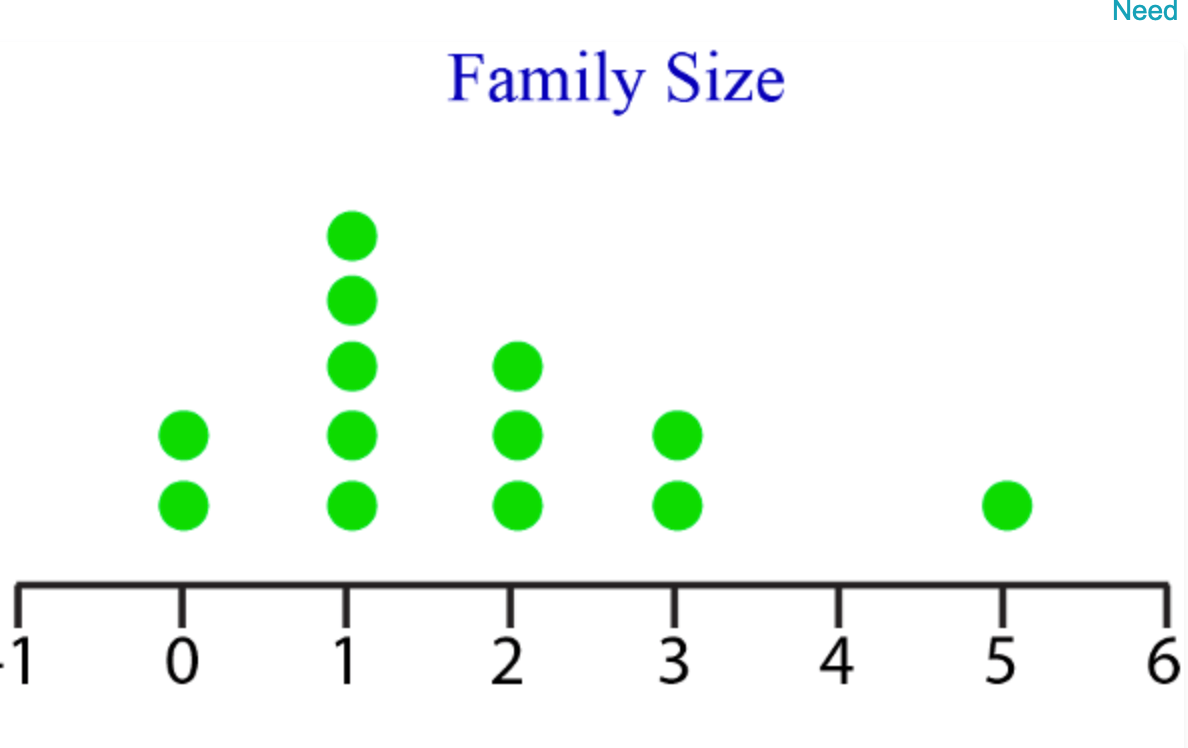
Eleven members of a family posed for a photo. Their ages were 35,3,63,61,5,5,5,39,35,37,and 32
How many members were atleast 35?
4
6
2
7
6
100
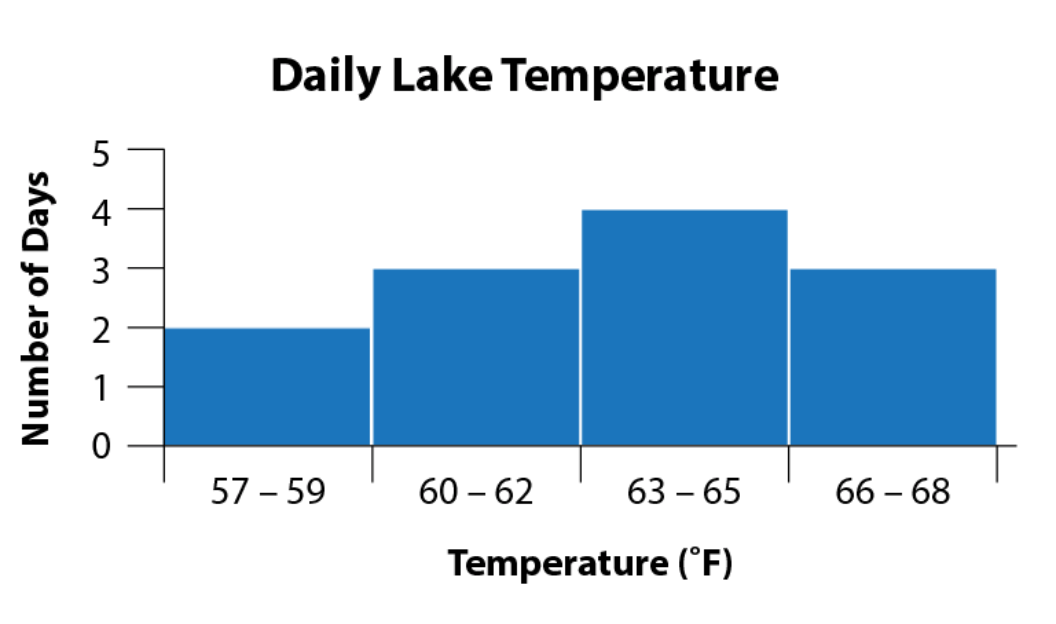
What makes this a histogram and not a bar graph?
Histograms "bins" measure quantitative ranges
100
What is the minimum and maximum in a data set?
Minimum is the smallest number in the dat set.
Maximum is the largest number in the data set.
100
Mean, Median, and Mode are the three measures of.....
Center
200
How many basketball players are included on the dot plot?
15
200
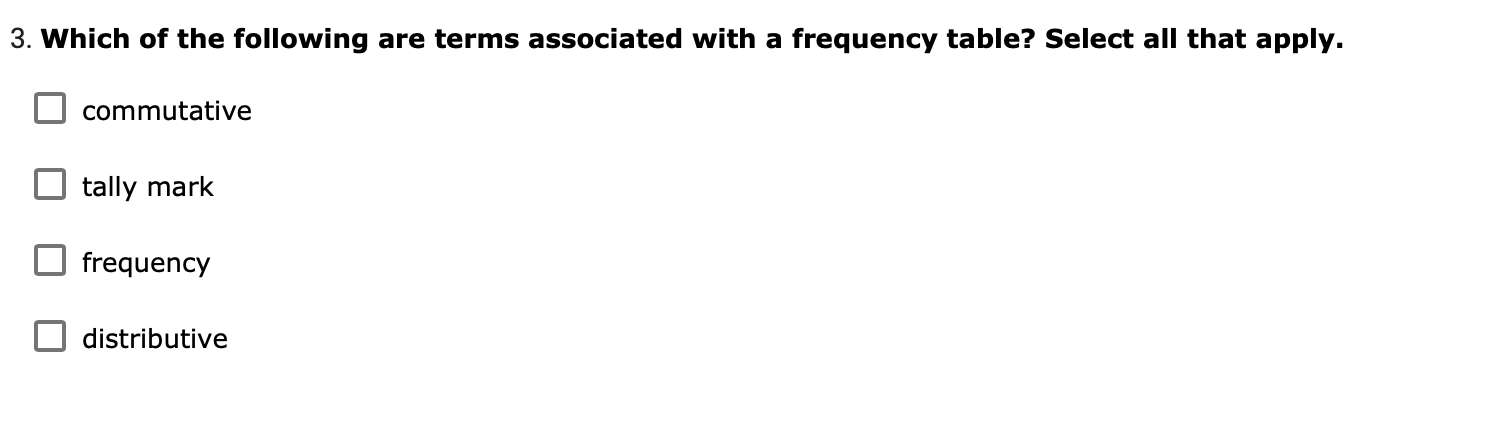
Tally marks
200
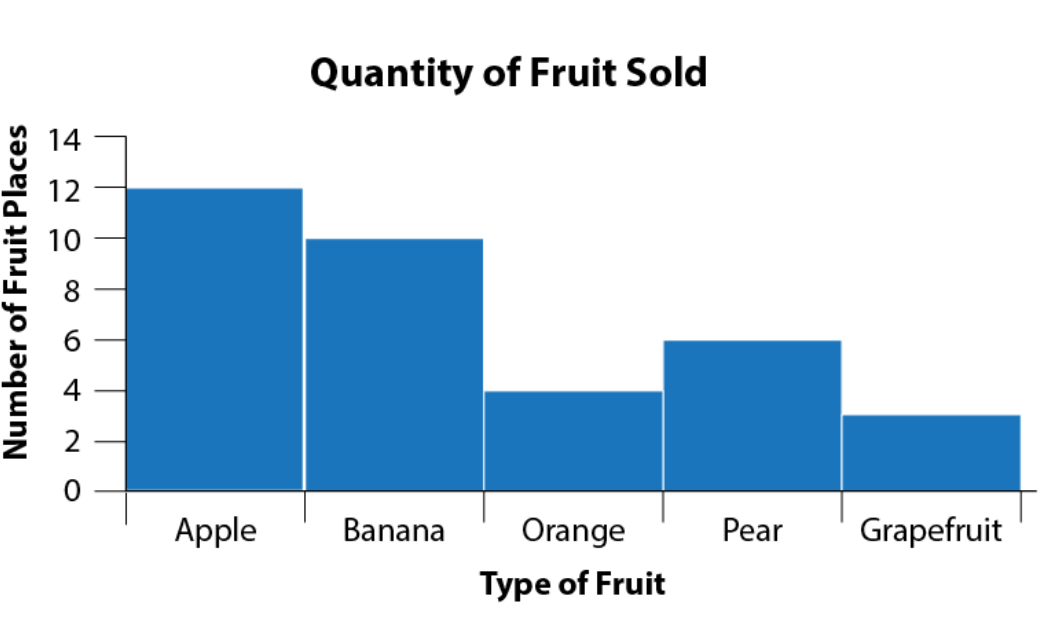
Which fruit had the highest frequency?
Apples
200
What is the order of the five number summary from left to right?
Minimum, lower quartile (Q1), median, upper quartile (Q3), Maximum
200
What is the mean of the data Set?
25,23,26,26,20
24
300
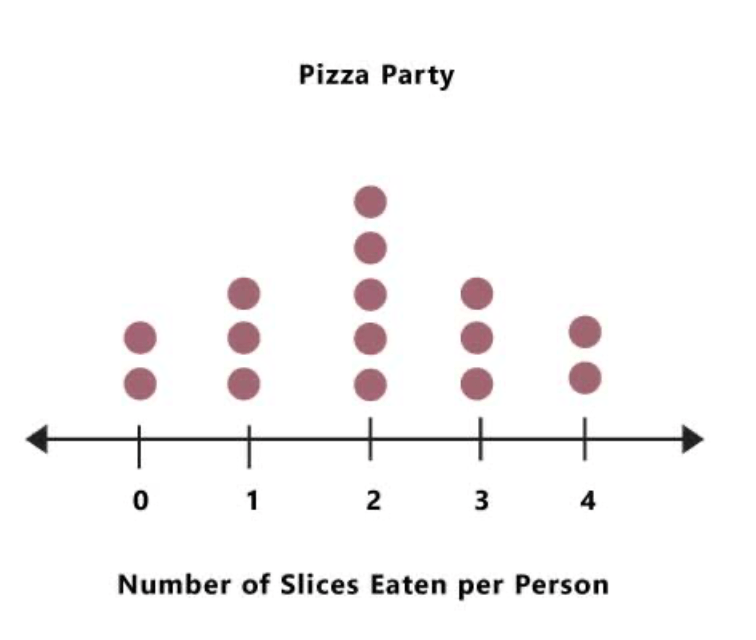
How many children ate fewer than 2 slices of pizza?
5
300
How many columns are in a frequency table, and what is in each column?
Three columns.
Column 1: Categories or numbers in data
Column 2: Tally Marks
Column 3: Frequency
300
There are no spaces between the bars of a histogram because the intervals are _____.
sporadic
continuous
missing
all the same
Continuous
300
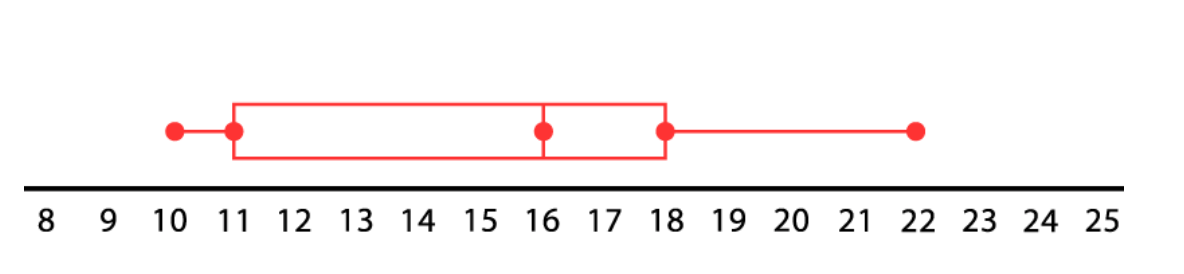
What is the Q3 of this data set by looking at the box plot?
18
300
Determine the Mode from the data set.
26, 35, 23, 27, 19, 23, 44, 19, 23, 23, 26, 27, 35
23
400
A dot plot is a data distribution that uses dots to show the frequency of the values that occur within a data set. Each dot on the number line represents _____.
A. an observation about the set
B. a category of the set
C. the frequency of the set
D. a value in the set
D. A value in the set
400
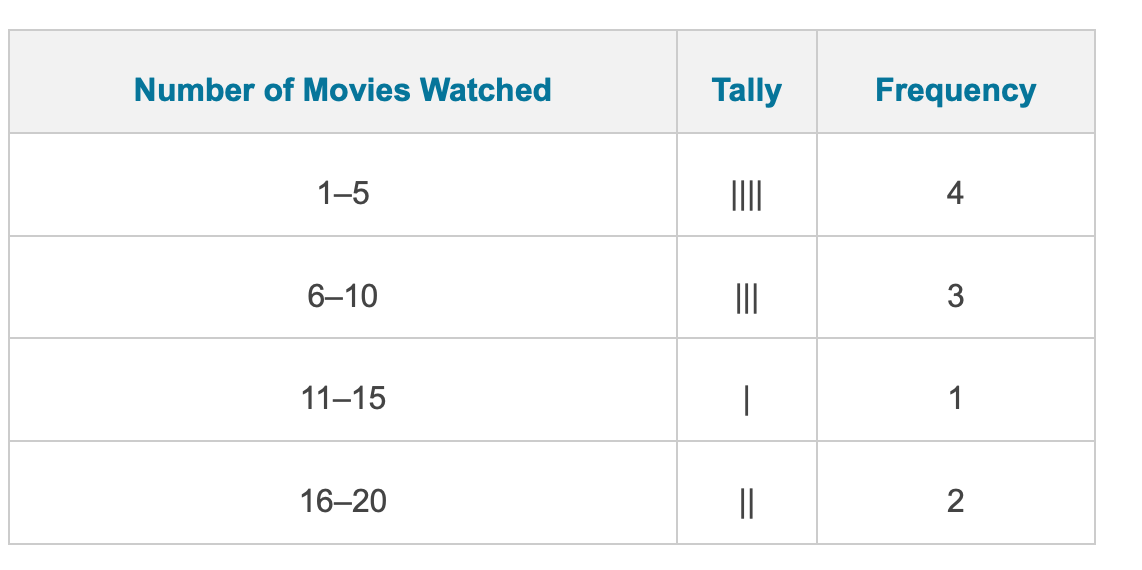
How many people watched less than 16 movies?
8
400
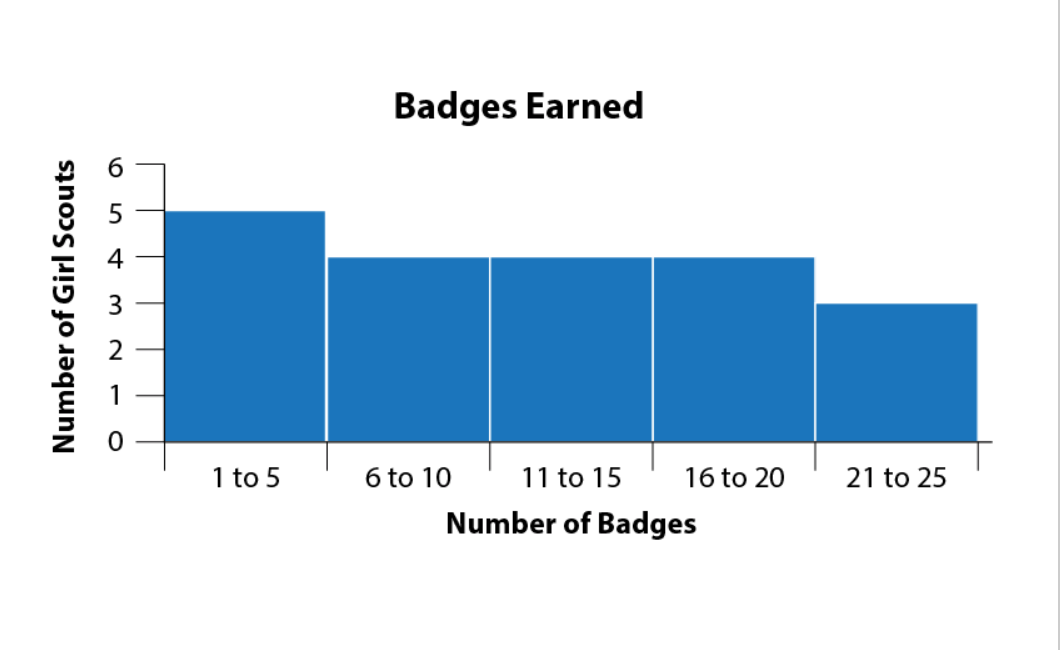
How many total badges were earned?
20
400
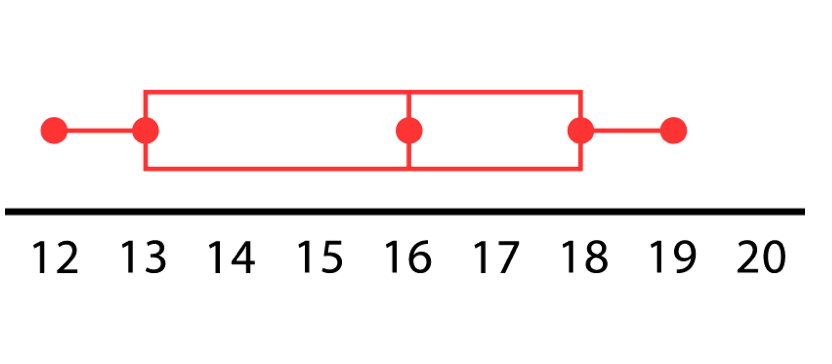
What is the IQR?
5
400

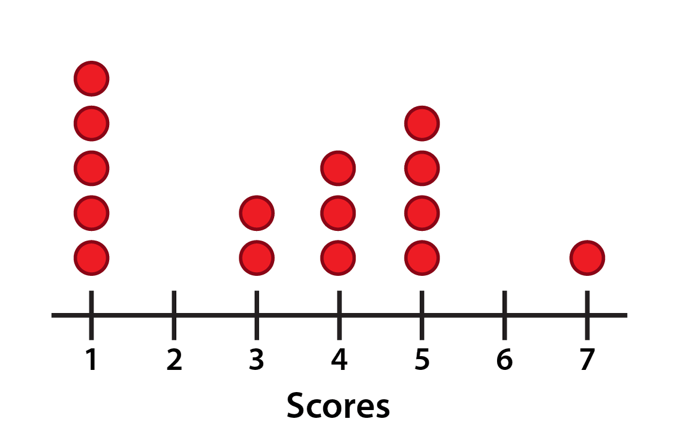
What is the median Score?
4
500
A
500
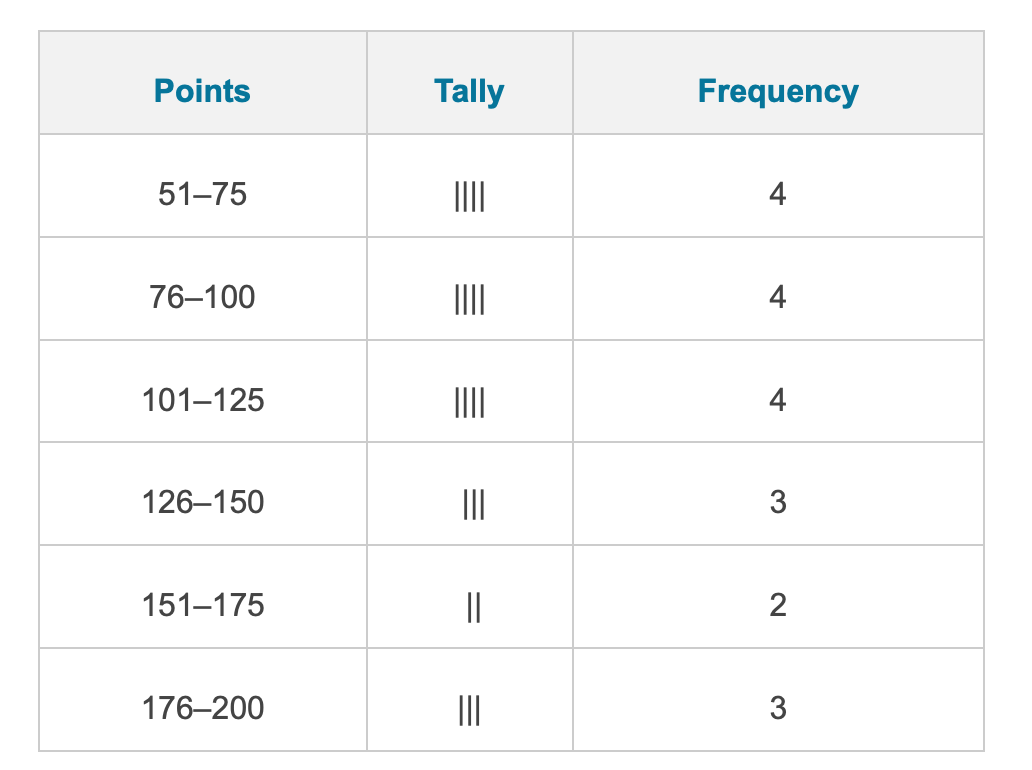
Which points had the lowest frequency?
151-175
500
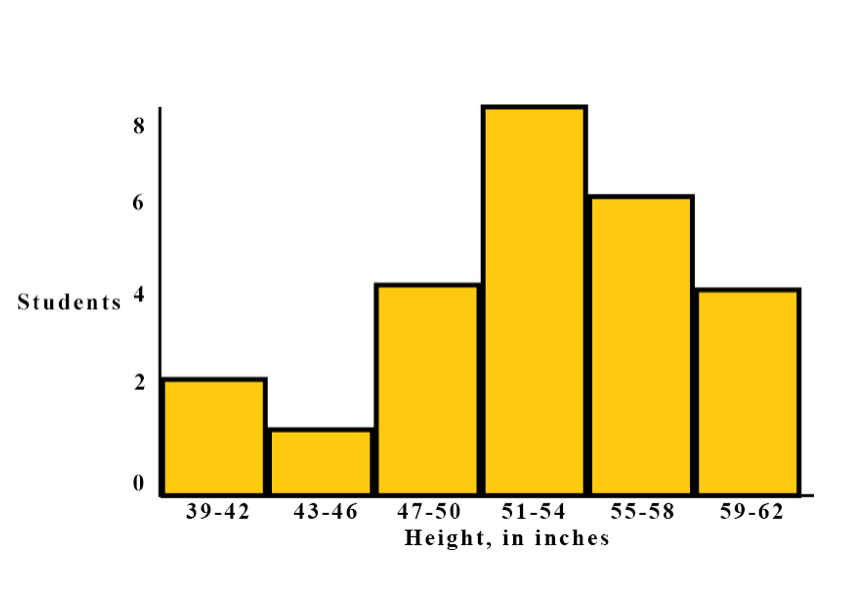
DOUBLE JEOPARDY!!!!What percent of people measured between 47-58 inches tall. write a fraction of people in stated bins over total people, scale fraction to 100 to get your percent :)
18/25= 72/100 which is 72%
500
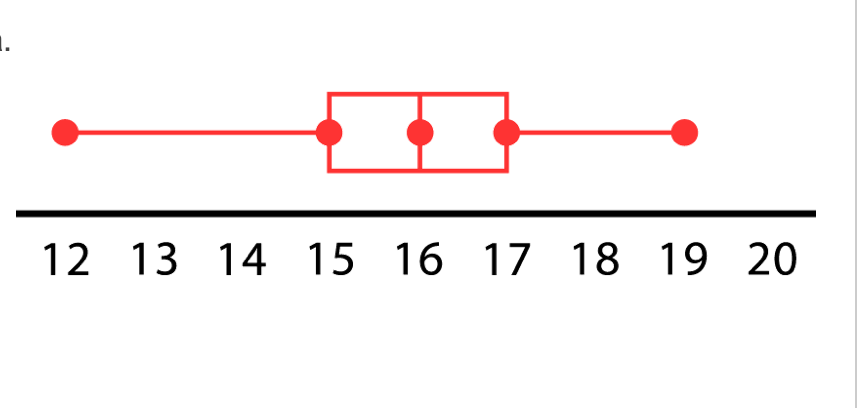
What % of the data set is greater than 15?
75%
500
What is the Median AND Range of the following Data?
27, 48, 35, 25, 31, 44, 56, 49, 48 52, 33, and 38
Range= 31
Median 41 If you said 50 for median, you did not order least to greatest :)