Dot Plots
Frequency Table
Dot Plots
Data Collection
100
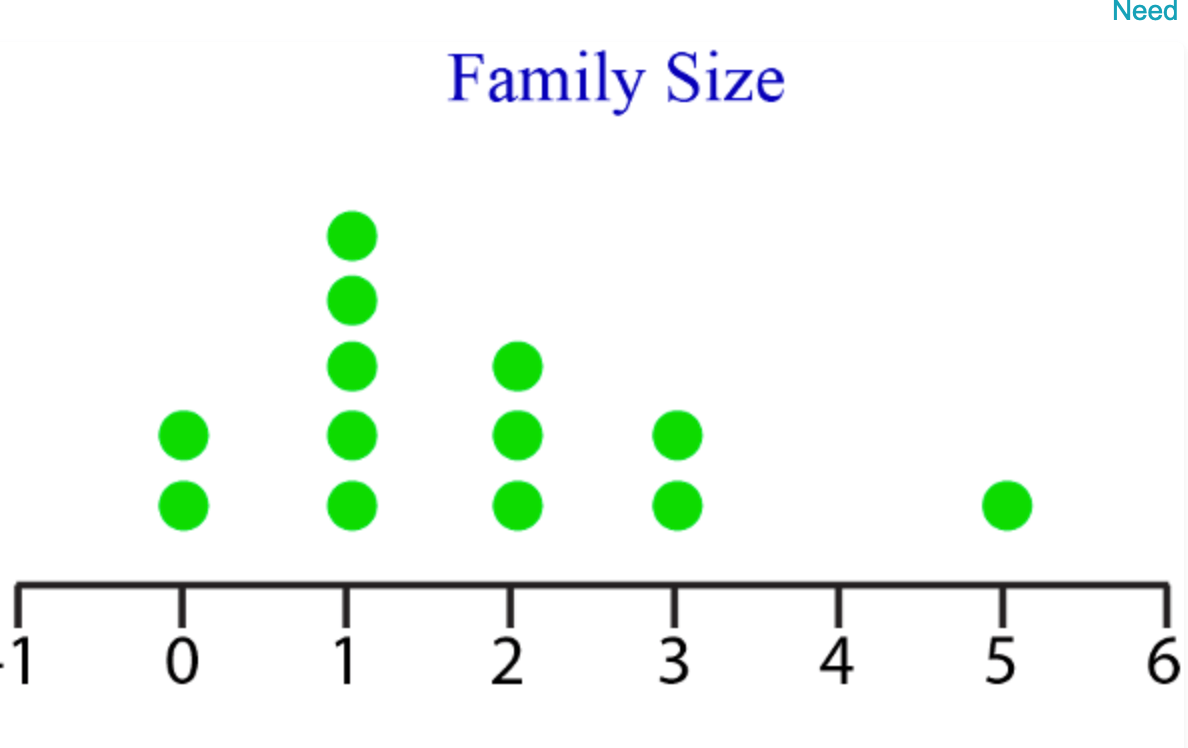
How many families have more than 6 members?
0 family.
100
2
100
A teacher asked 20 students how many books they read last summer. The dot plot displays the data.
How many students read 5 books last summer?

3 students
100
How many projectors do we have in this classroom?
1 projector.
200
How many basketball players are included on the dot plot?
15 Basketball Player.
200
Tally marks
200
The following dot plot shows the number of hours 15 people exercised per week.
Most people exercised _______ hour/hours.
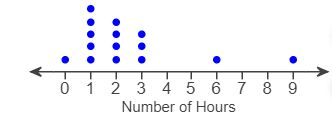
1 hour.
200
When collecting data, it's important to ask relevant questions that align with the objectives. TRUE/FALSE?
TRUE!
300
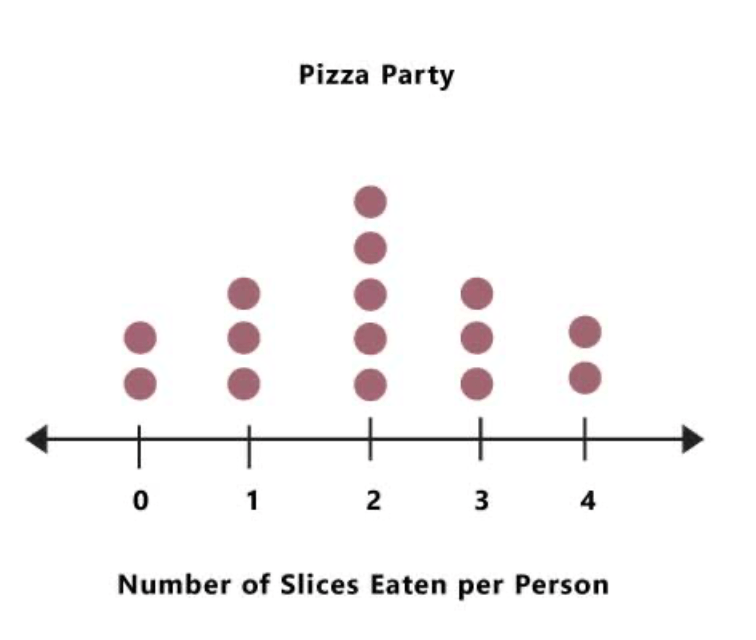
How many children ate fewer than 2 slices of pizza?
5 children.
300
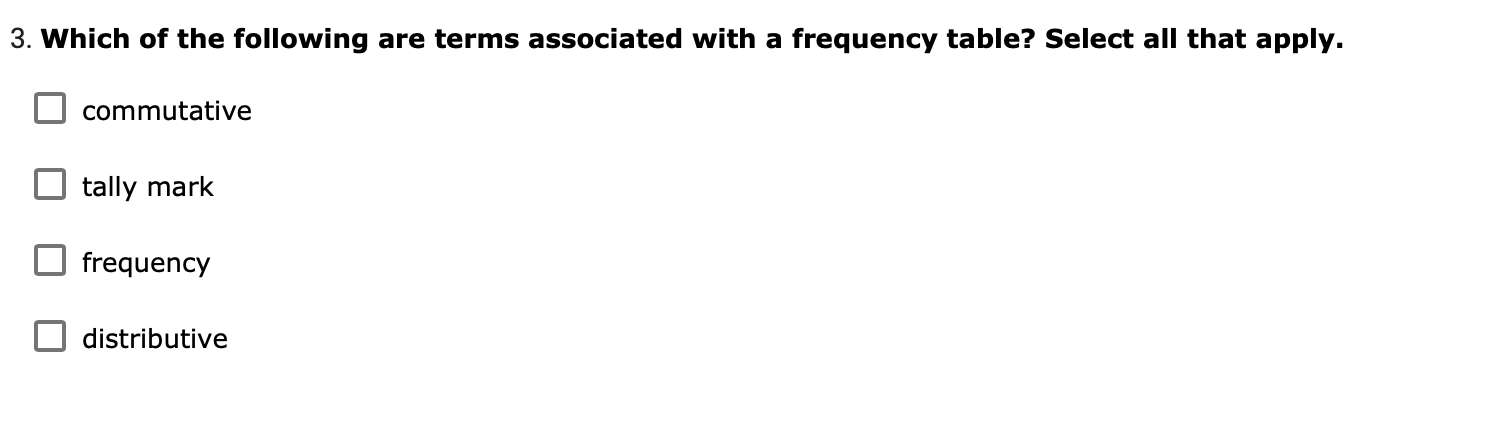
How many columns are in a frequency table, and what is in each column?
Three columns.
Column 1: Categories or numbers in data
Column 2: Tally Marks
Column 3: Frequency
300
A teacher asked 20 students how many books they read last summer. The dot plot displays the data.
How many students read 8 books last summer?

1 student.
300
Mention two ways how we can collect data!
By observing with our eyes and asking questions.
400
A teacher asked 20 students how many books they read last summer. The dot plot displays the data.
How many students read 2-5 books last summer?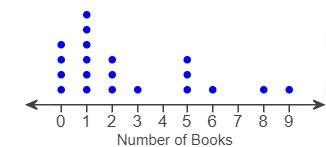
7 students.
400
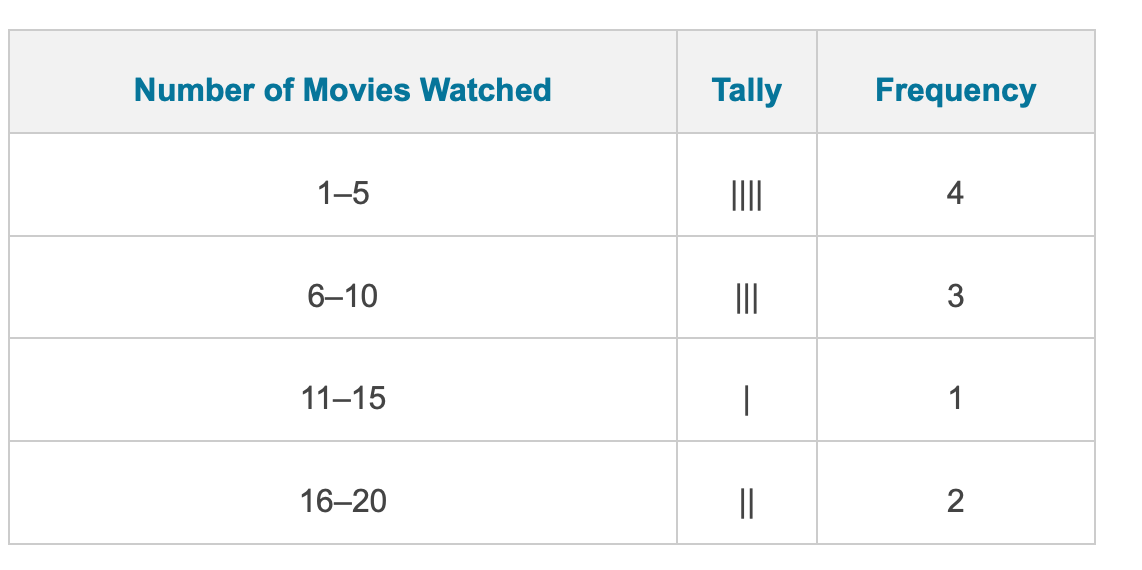
How many people watched 6-10 movies?
3
400
How many children ate more than 1 slice of pizza?
10 children.
400
Create one questionnaire to collect data about the opening of a new mall!
Answers can vary as long as they are related to the topic.
500
A
500
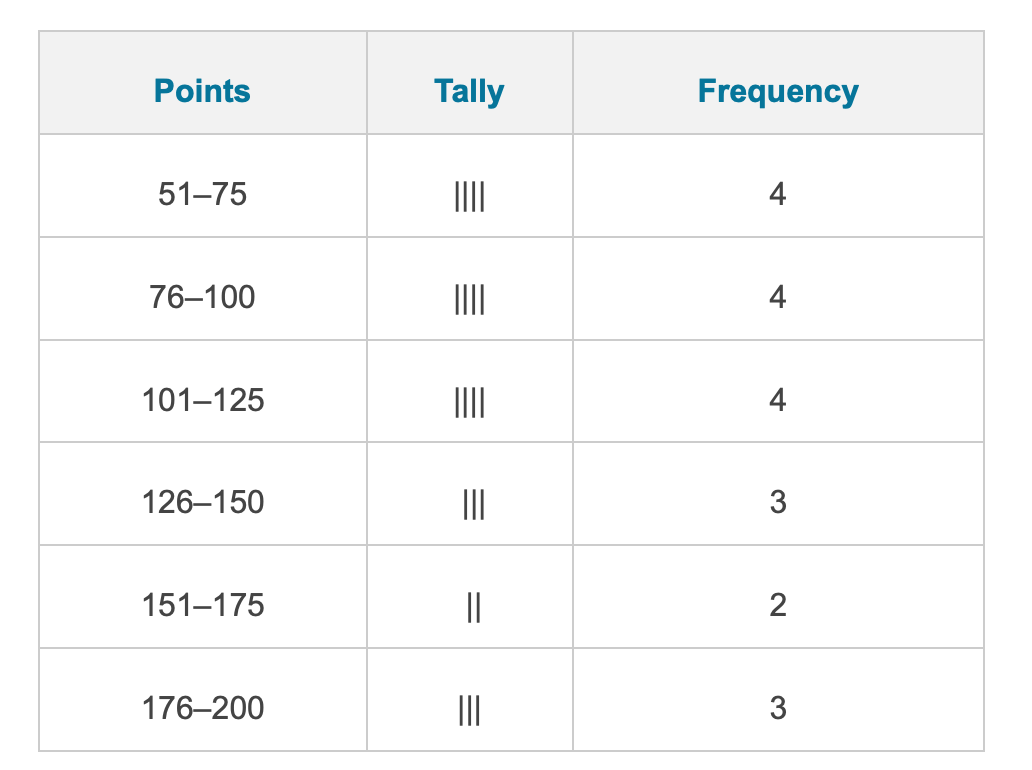
Which points had the lowest frequency?
151-175
500
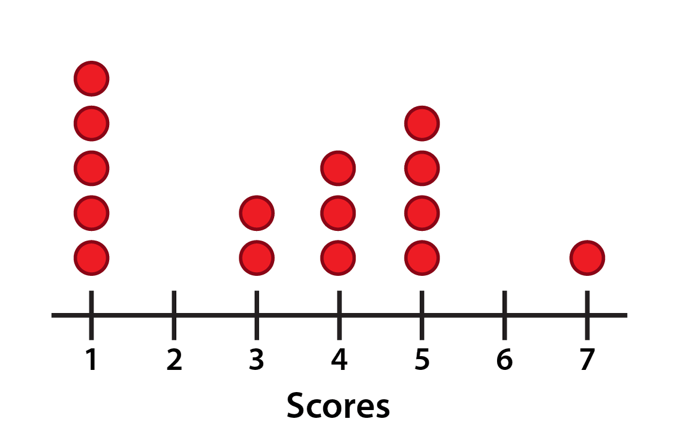
How many basketball players have scores greater than 3?
8 basketball players.
500
Create two questionnaires to collect data about the opening of a new medical clinic!
Answers can vary as long as they are related to the topic.