Identifying Graphs
Analyzing Data
Reading Graphs
100

Line plot
100
An outlier is
a value that is much higher or much lower than other values in the data set
100
What is the most popular sport?
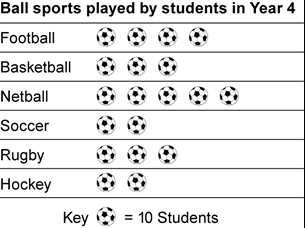
Netball
200

Bar Graph
200
Information that is collected and represented on a graph is called ___________________.
Data
200
Which is the least popular sport?
Soccer and Hockey
300
This kind of graph uses a horizontal axis with a regular scale and with each piece of data marked as an X
Line plot
300
Range is
the difference between the highest and lowest data points
300
Is there an outlier? What is it?
11
400
Pictograph
400
Mode is
the value that has more data than any other value in the data set
400
23 students were asked when they first went fishing. What is the typical age they first went fishing?

6 years old
500
How is a bar graph different from a line plot?
Answers will vary
500
How do you find what is "typical" in a set of data?
By counting up all the data that is represented and then finding the half way point
500
How many cupcakes were sold on Thursday? How do you know?
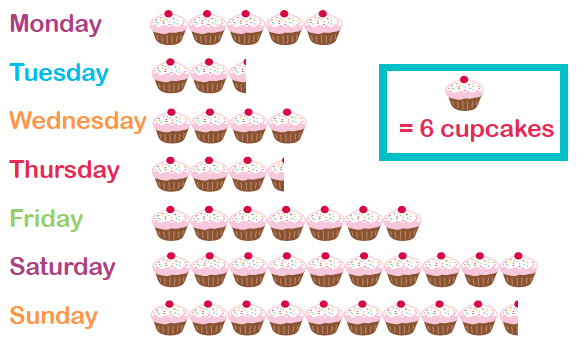
21 because there are 3 full cupcakes, I know 3x6=18 and half a cupcake is equal so 3, so 18+3=21