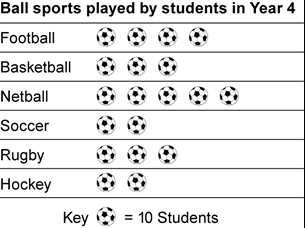
This kind of graph uses pictures or symbols to represent the data?
Pictograph
Data can be shown on a _________.
graph
How many 4th graders played basketball this year?

30
12+5+3
20
What is the most popular sport for students to play?

Netball
What kind of graph is this?
Bar Graph
Information that is collected and shown on a graph is called ___________________.
data
13 people voted for PE as their favoite subject. 4 more people voted for Music than PE. How many people like music?
17
42+15
57
How many more people own goldfish than rabbits?
2
What kind of graph is this?
Pictograph
Every graph has a _______ at the top.
Title
How many cupcakes were sold on Wednesday?

24
46+26
72
How many more students played football than hockey?

20
How is a tally graph different from a picture graph?
A tally graph uses tally marks instead of pictures.
Using lines to count things instead of using numbers are called _________________.
Tally marks
If 
Then what does 
 5 apples
112+14
126
How many more people owned dogs than hamsters?
3
This kind of graph uses bars to display the data?
Bar Graph
When you ask people a question and collect their data, you are giving a ____________.
survey

What is the difference between the number of students who have cats for pets and the number of students who have goldfish ?
4 more students own cats than own goldfish
122+122
244
How many cupcakes were sold on Tuesday?
Be careful!

15