Mean
Median
Mode
Range
Plot Diagrams
Trivia
Halloween Trivia
100
What two other names are used to define or represent the mean?
Average or Fair Share
100
What is the name/word we use to describe the median of a data set?
Middle - the median is the middle.
100
The mode of the data is the value that appears the ________ ________.
Most Often
100
What name/word isused to define or represent the range?
Spread - the range is the spread of the data set.
100
The stem-and-leaf plot below displays the number of times US States individuals have visited:
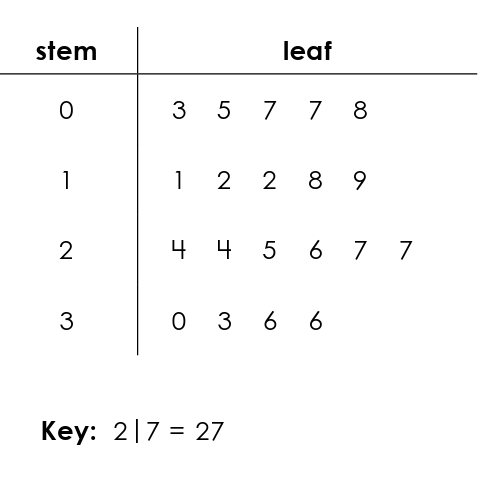
Based on the stem-and-leaf plot above, how many individuals were surveyed with this question?
20 individuals
100
Which animal has three hearts?
Octopus
100
What colour is usually associated with Halloween: orange or pink?
Orange
200
Use the data set below to calculate the mean.
8, 4, 12, 20, 16
Mean is 12
200
Use the data set below to calculate the median.
24, 8, 4, 12, 20, 16
Median is 14
[12 + 16 = 28 / 2]
200
Use the data set below to calculate the mode.
12, 5, 8, 12, 19, 3, 12, 7, 15
Mode is 12
200
Use the data set below to calculate the range.
24, 8, 4, 12, 20, 16
Range is 20
200
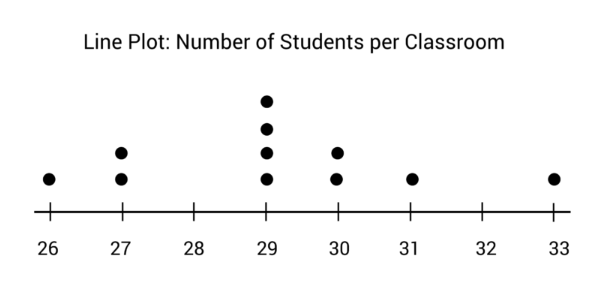
Based on the line plot above, how many classrooms are represented?
11 classrooms
200
What is the only continent that is also a country?
Australia
200
What do children say when they knock on doors at Halloween?
Trick or Treat
300
Use the data set below to calculate the mean.
7, 14, 18, 21, 25, 3, 10, 30
Mean is 16
300
Use the data set below to calculate the median.
14, 2, 8, 19, 11, 5, 17
Median is 11
300
Use the data set below to calculate the mode.
4, 18, 9, 4, 22, 18, 11, 4, 18, 6
Mode is 4 & 18
300
Use the data set below to calculate the range.
14, 3, 29, 8, 42, 19, 7
Range is 39
300
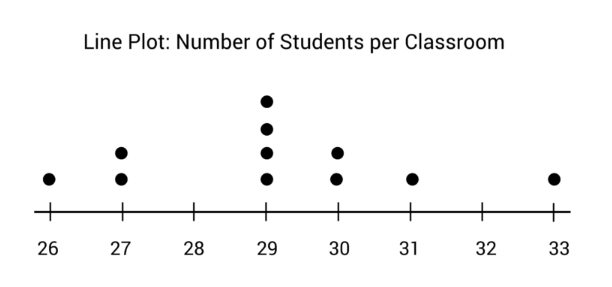
Based on the line plot above, how many classrooms have 30 or less students?
9 classrooms
300
What is the largest planet in our solar system?
Jupiter
300
What vegetable is carved to make a Jack-o'-lantern?
Pumpkin
400
Use the data set below to calculate the mean.
15, 50, 10, 45, 20, 35, 25, 40, 30
Mean is 30
400
Use the data set below to calculate the median.
25, 10, 3, 18, 7, 30, 14, 21
Median is 16
[14 + 18 = 32 / 2]
400
Use the data set below to calculate the mode.
5, 12, 18, 3, 29, 41, 14, 8
There is no mode.
400
Use the data set below to calculate the range.
88, 12, 54, 91, 33, 67, 105, 40
Range is 93
400
The stem-and-leaf plot below displays the number of times US States individuals have visited:
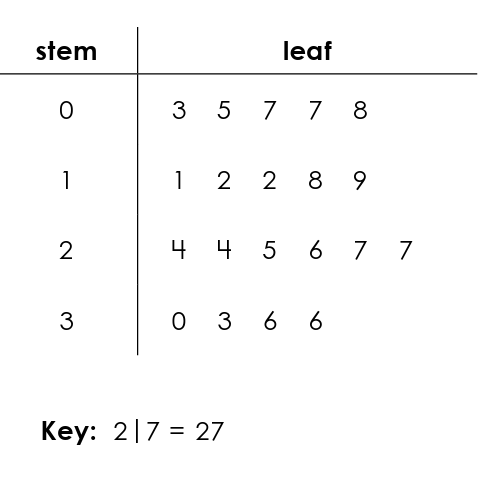
Based on the stem-and-leaf plot above, have more individuals visit more than or less than 25 states?
Less than 25 states
400
Which fruit has its seeds on the outside?
Strawberry
400
Which spooky creature is said to turn into a bat?
Vampire
500
Use the line plot below to calculate the mean.
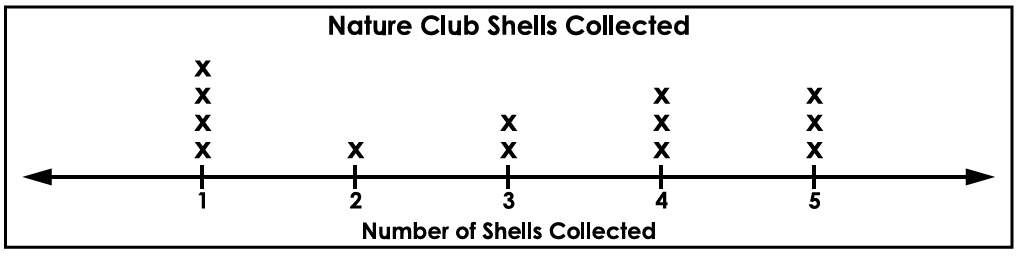
Mean is 3
500
Use the stem-and-leaf pot to calculate the median.
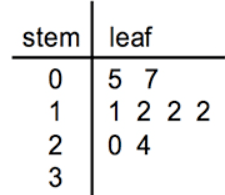
Median is 12
[12 + 12 = 24 / 2]
500
Use the stem-and-leaf plot below to calculate the mode.
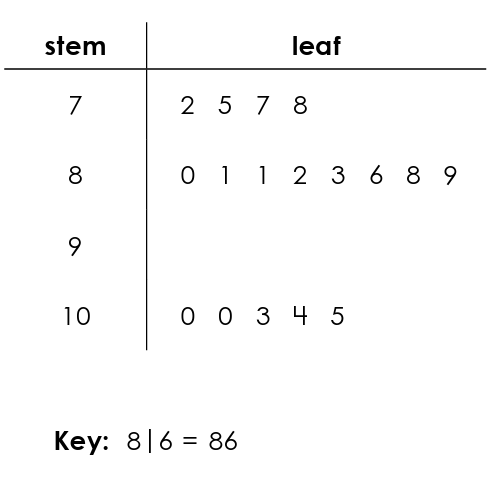
Mode is 81 and 100
500
Use the line plot to calculate the range.
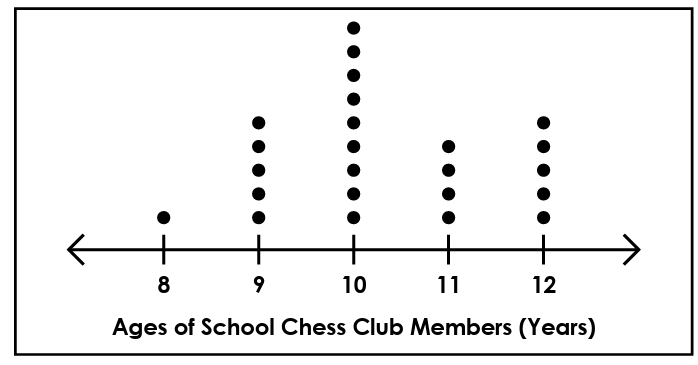
Range is 4
500
The data below represents the number of wins some MLB teams have so far this season.
Data Set: 66, 48, 73, 42, 31, 62, 70, 69, 41, 63, 65, 67, 64, 71, 63
Using the data set above - create either a stem-and-leaf plot or a line plot to represent the data. Be sure to include all parts.
*answers will vary*
500
How many sides does a dodecagon have?
12
500
What do witches traditionally ride on?
Broomstick