Data Lab 1
Data Lab 2
Fiscal Data/USAspending
Data Viz
Mix of Everything
100
The date (Month Day Year) that Data Lab was decommissioned.
What is November 1, 2022?
100
The year that Data Lab was launched.
What is 2017?
100
The USAspending motto.
What is Better Data, Better Government, Better Decision-making?
100
This data visualization may look like a bar chart, but it's actually a chart that shows the distribution of a quantitative variable.
What is a histogram?
100
Fiscal Data's launch date.
What is July 2020?
200
One of the most frequent places Data Lab work has been "cited."
What is Reddit?
200
The analysis that was dropped in 2021 from the site.
What is AFG Country Comparisons?
200
The first set of Topics pages that were published on Fiscal Data that were inspired by Data Lab.
What is America's Finance Guide?
200
This chart is a great example of a line chart being used to plot this kind of data.
What is time series?
200
The dataset "published" and updated daily on Data Lab, which also produced lessons learned for Fiscal Data.
What is the Daily Treasury Statement (DTS)?
300
The visualizations Data Lab built with the sole purpose of persuading OMB to drop its opposition to the re-launch of USAspending.
What is Competition in Contracting?
300
The analysis that Data Lab has frequently gotten requests to replicate because it ties spending data together with extremely complex data.
What is Colleges & Universities?
300
The number of data tables published on Fiscal Data.
What is 84.
300
The visual below is an example of this type of data visualization, whose namesake used one to show the energy efficiency of a steam engine in 1898.
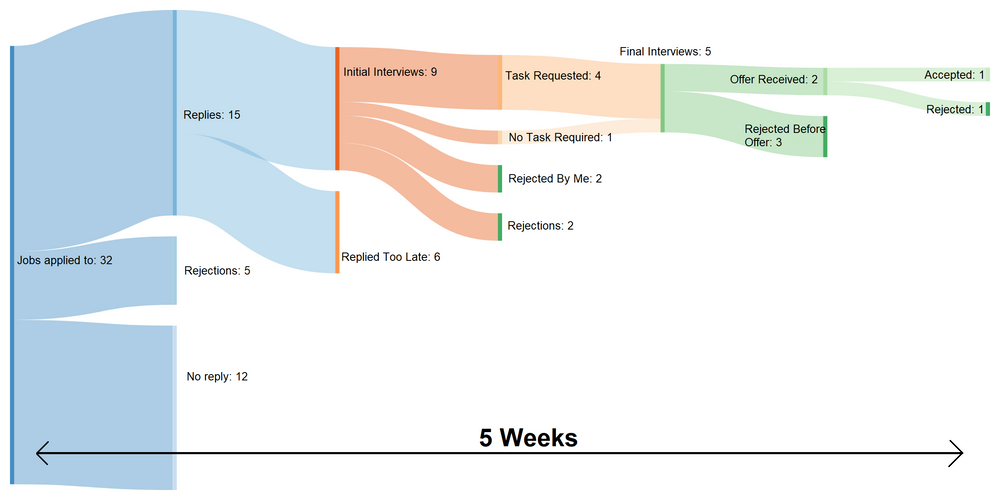
What is Sankey?
300
A well-known government program that is also a Wikipedia page where Data Lab was cited.
What is Medicare?
400
The Nobel Prize winning economist who cited Data Lab research on federal employee locations and salaries.
What is Paul Krugman?
400
The domain where Data Lab was originally launched.
400
The dataset for which we have the most historic data on Fiscal Data.
What is Historical Debt Outstanding? (Goes back to 1790!)
400
The d3 library that Fiscal Data uses for its visualizations
What is nivo?
400
Instead of 'good game,' the 'gg' in 'ggplot' stands for the title of this groundbreaking book on visualizations.
What is Grammar of Graphics by Leland Wilkinson?