Types of graphs
Data management
Mean, Median, Mode, Range
Drawing conclusions from a set of data
Other
100
What data would you use when making a bar graph?
Best suited to show numbers that are independent of each other, ex- type of foods, favourite movie
100
What is primary data?
Data that you collect
100
How do you find the mean? What is the mean of the set of numbers? 34, 12, 25, 18, 31
Add all the numbers and divided by how many numbers there are
- 120 divided by 5= 24
100
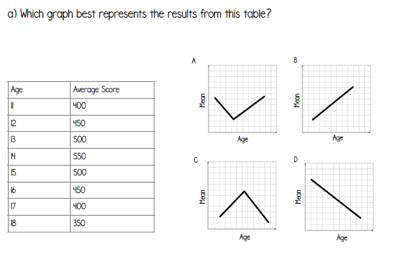
C
100
The table below shows grain used to make cereal at a breakfast food factory.
Oats- 24%
Rice- 15%
Corn- 26%
Wheat- 35%
Which of the following statements are true?
a) The amount of wheat used is more than the combined amount of corn and oats.
b)The amount of corn used is more than the combined amount of oats and rice.
a)False- 50
b)False- 39
200
What data would you use when making a broken line graph?
Best suited to show you how numbers have changed over time, ex- temperature
200
What is secondary data?
Data that someone else has collected
200
How do you find the median? What is the median of the set of numbers? 63, 18, 26, 35, 71, 54, 29, 12
Number in the middle
- 12, 18, 26, 29, 35, 54, 63, 71
- 29 + 35=64 divided by 2
- 32
200
How many visitors are there when the temperature is at 94?
What is the temperature at when there are 360 visitors?
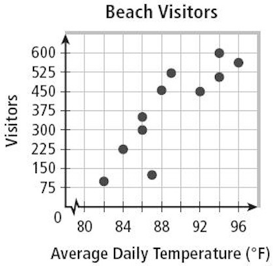
- 515 and 600
- 86
200
Shawn measured the shoe size of his classmates and received the following data: 8, 7, 8, 6, 10, 5, 10, 8, 6 and 6.
Find the mean shoe size of his classmates.
74 divided by 10= 7.4
300
What are the first two things to be completed when making a line graph?
Titles (top, side, bottom) and label each X and Y axis
300
Name 3 reasons why graphs can be misleading?
- Graph not labeled properly
- Scale not starting at zero
- Axis’s skip numbers
300
How do you find the mode? What is the mode of the set of numbers? 12, 35, 13, 96, 88, 12, 96, 13, 35, 79, 13
Number that appears the most
- 13
300
Make a stem and leaf plot using the information below:
Favourite Subject
Language 32
Math 23
Gym 19
Science 12
French 25
12, 19, 23, 25, 32
- 1: 2, 9
- 2 : 3, 5
- 3: 2
300
The daytime temperature recorded in September over five consecutive days was: 17.1, 9, 11.8, 19, 7.
What is the range of temperatures over the five days?
12
400
What data would you use for a pie graph?
Best suited to show you how a whole is divided into different parts, ex- show how a budget was spent
400
What are the two steps when making a stem and leaf plot?
Order the numbers from least to greatest, and make sure to cross off the numbers when putting them into the plot
400
How do you find the range? What is the range of the set of numbers? 14.6, 12, 16.5, 18, 11
The difference between the highest and lowest number in a set of data
- 17
400
Four classes collect cans for the Swim and Skate food bank donation. The total number collected was 288. Find how many cans class 3 collected.
Class 1- 78
Class 2- 55
Class 3-?
Class 4- 102
Class 3- 53 cans collected
400
A meteorologist is tracking the average rainfall of Michigan for an entire year. What graph would work best?
- Bar graph
- Line graph
- Pie graph
line graph
500
What data would you use for a stem and leaf graph?
Shows how the data is spread- that is the highest number, lowest number, most common, and outlier
500
What is the equation when you have data that does not add to 100 but you need to put it in a pie graph?
Find the total, then divide the numbers by the total and multiple by 100.
500
What is the mean, median, mode and range of the data below?
102, 96, 135, 118, 108, 134, 121, 128, 265, 85, 145, 123
- 85, 96, 102, 108, 118, 121, 123, 128, 134, 135, 145, 265
- Median- 121 + 123 divided by 2= 122
- Mean- 1560 divided 12= 130
- Mode- No mode
- Range- 85- 265= 180
500
Sydney is collecting money for the Jump Rope for Heart fundraiser. Below is a chart what she collected for a week. The total money collected for the entire week is $360. How much money did she collect on Friday?
Monday- $50
Tuesday- $125
Wednesday- $75
Thursday- $25
Friday- ?
Friday - $85
500
A group of teens and a group of adults are surveyed about their favourite four radio stations.
What graph would work best?
- Pie graph
- Stem and leaf plot
- Bar graph
Bar graph