Tally Chart/Tables
Bar Graphs
Pictographs
100

How many licorice jellybeans are represented in this tally chart?
6
100

How many people prefered Comedy movies?
4 people
100
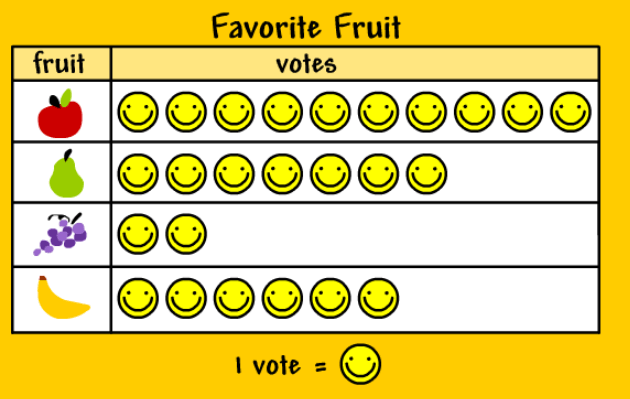 What is the most popular fruit?
Apples
200

How many more people took a bus than took a car?
3
200
How many people preferred Action movies?
5 people
200
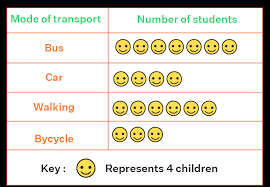
How many children took a car?
16
300
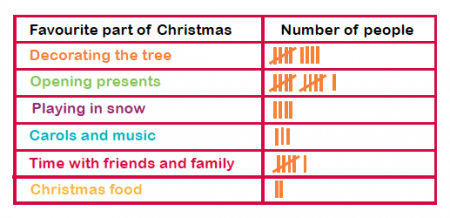 How many people liked opening presents and decorating the tree?
20 people
300

In what two months were 7 people born?
Sep and Dec
(September and December)
300

How much is each pizza worth?
4 Children
400

How many more girls are there than boys in Ms. Williams' class?
21
400
What is the difference between the month with the most birthdays and the month with the least birthdays?
9 people
400

How many more hours were spent on sleep than on online classes?
6 hours
500
How many boys are there in the entire 3rd grade?
48
500

How many people liked soccer or baseball IN ALL?
17 people
500
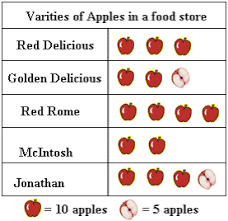
How many more Jonathan apples were there than Golden Delicious apples?
15