Vocabulary
Dealing With Data
Frequency Table
Line Plots
Stem and Leaf PLots
100
The measure of center that refers to the data value that appears most often is called the ________
MODE
100
What is the mode of this data set?
2, 4, 4, 5, 6, 7, 8
4
100
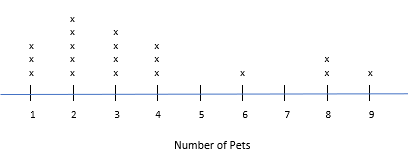
How many students have 3 pets? Refer to Pets Frequency Table
1
100
What is the mode of this data set?
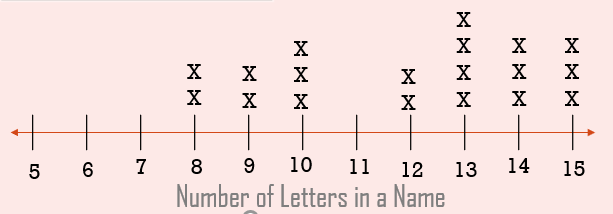
13 letters
100
According to the stem and leaf plot, how many trees are between 16 and 25 inches?
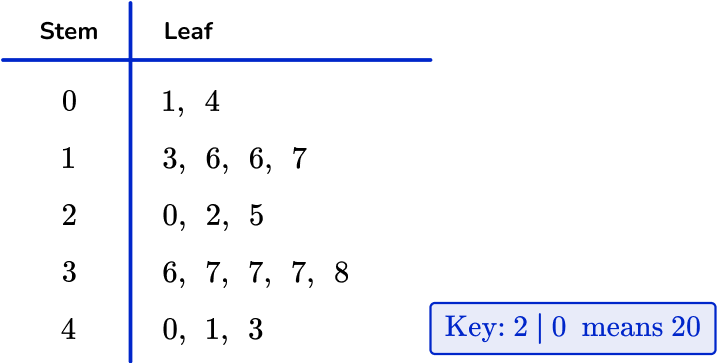
6 trees
200
The ___________ is determined by finding the middle value in an ordered data set.
MEDIAN
200
What is the median of this data set?
4, 6, 9, 10, 13, 14, 17
10
200
How many more students have 0 pets than 1 pet? Refer to Pets Frequency Table
3
200
What is the range of this data set?
15 - 8 = 7 letters
200
According to the histogram, what is the height of the largest tree?
43 inches
300
When we calculate the RANGE, we find the _______________ between the maximum value and the minimum value.
difference
300
What is the range of this data set?
87, 75, 91, 83, 89, 77, 98
98 - 75 = 23
300
What is the mode of the frequency? Refer to Pets Frequency Table
1
300
What is the median of this data set?
3 hours
300
What is the mode for the tree heights?
37 inches
400
"How many more"
"Find the difference"
"How many less"
Subtraction
400
Calculate the mode of this data set.
10, 5, 6, 5, 8, 12, 10
10
400
What is the range of the frequency? Refer to Pets Frequency Table
6
400
What is the median of this data set?
3 pets
400
How many trees are at least 25 inches tall?
9 trees
500
"In all"
"Sum"
"altogether"
"how many?"
addition
500
What is the median, mode, and range for this set?
4, 9, 1, 5, 2, 3, 4, 2, 3, 1, 3, 2, 3
Median:3 Mode:3 Range:8
500
What is the median of the amount of pets? (**Hint pay attention to the frequency)
Mean (because there are no outliers and none of the values appear more than twice)
500
What is the mean of this data set?
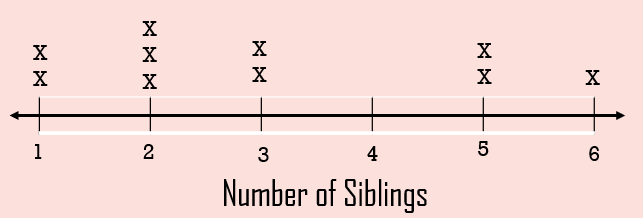
3 siblings
500
What is the median and range of the tree heights?
median: 25
range: 42