Pictographs
Bar Graphs
Line Plots
Frequency Tables
Input/Output
100
The picture graph below shows the times people prefer to visit the dentist.

What time had the most people?
11am
100

How many children chose Yellow as their favorite color?
9 children picked yellow as their favorite color.
100
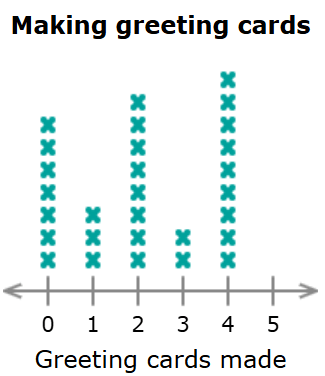
How many greeting cards were made altogether?
There were 29 greeting cards made altogether.
100
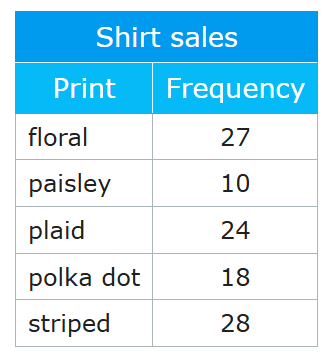
True or False: Striped shirts sold the most.
True
100
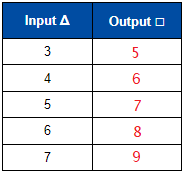
Find the rule for this chart.
The rule is +2.
200
How many students like green?
18 students like green.
200
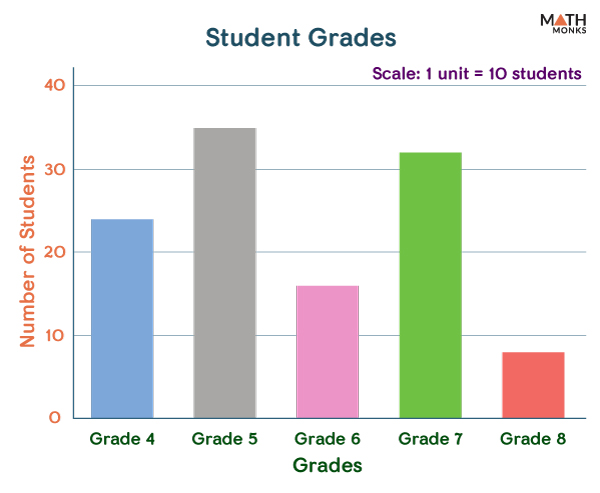
How many students are in 5th grade?
There are 35 students in 5th grade.
200
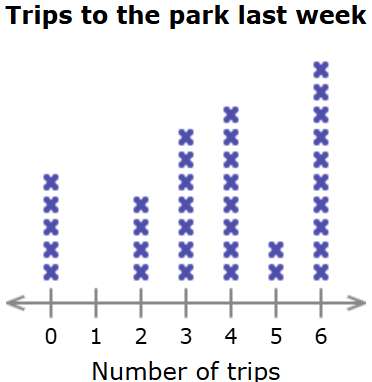
True or False: There were two more park trips made from the "2 trips" group than the "5 trips" group.
True.
200
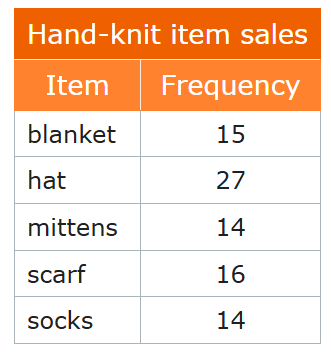
How many fewer socks are there than hat?
There are 13 fewer socks than hat.
200
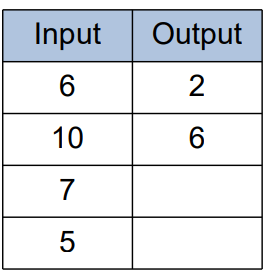
Find the missing values.
7 --> 3
5 --> 1
300
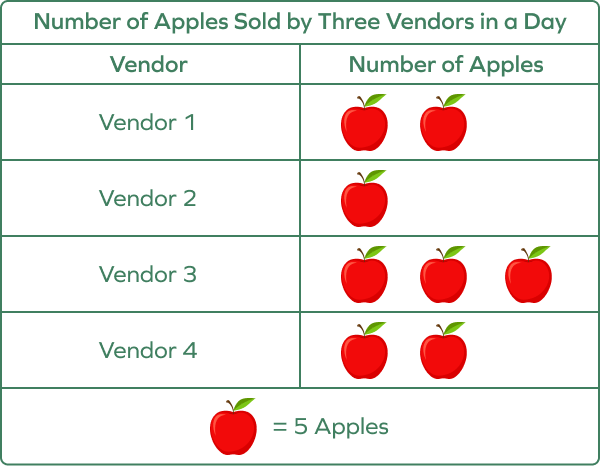
How many apples did Vendor 3 and Vendor 4 sell altogether?
They sold 25 apples altogether.
300
Determine what scale (2, 5, or 10) works best for this data set. Explain your reasoning.
A scale of 2 works best for this data set, because of we skip count by 2, we get all of those data numbers.
Example: 2, 4, 6, 8, 10, 12
300
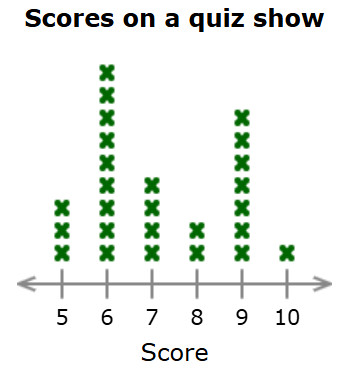
How many fewer points did 9 points have than 8 points?
There are 5 fewer points.
300
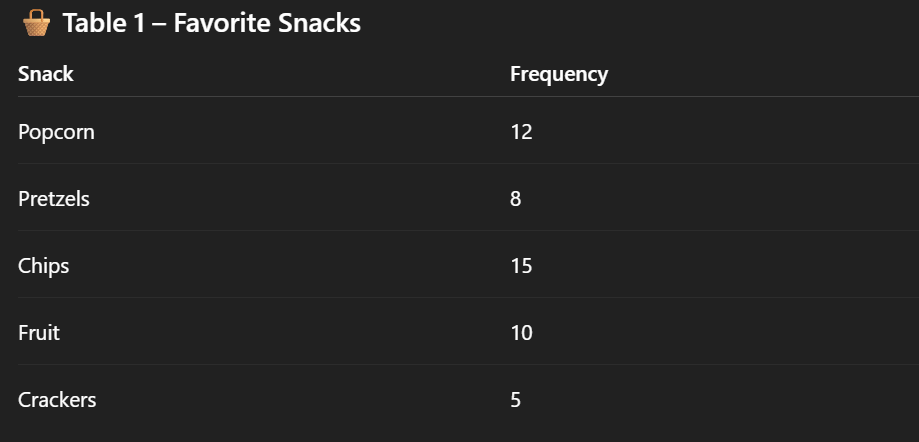
How many more people like fruit and crackers than pretzels?
7 people like fruit and cracker more.
300
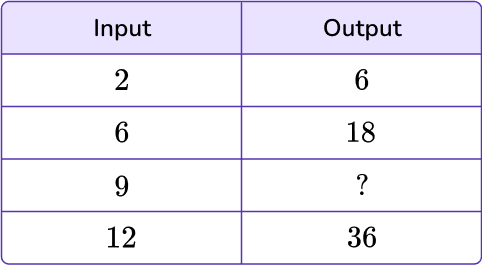
1) State the rule.
2) Find the missing value.
1) 3 + 3 + 3 or x 3
2) 27
400

How many more vanilla ice-cream cones were sold than strawberry cones?
50 more vanilla ice-cream cones were sold than strawberry cones.
400
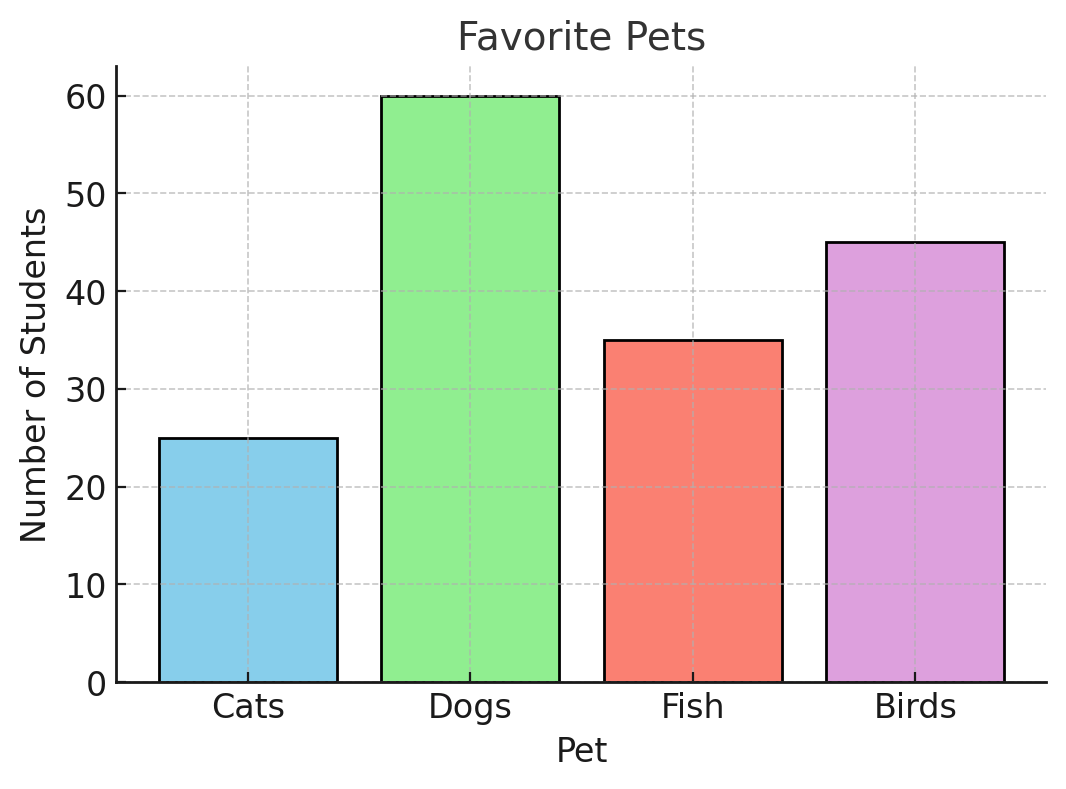
How many fewer students chose cats than dogs?
35 fewer students chose cats than dogs.
400
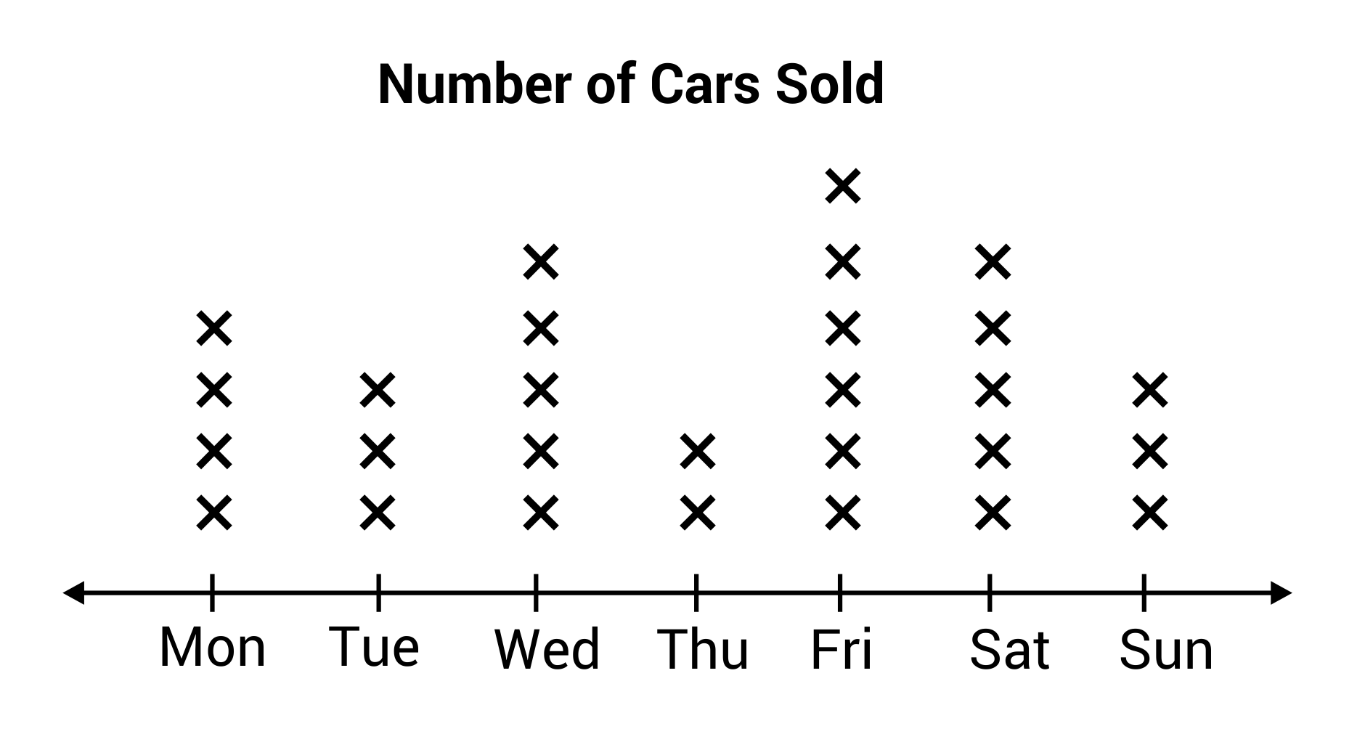
How many more cars were sold on Tue and Sun than Thu?
There were 4 more cars sold.
400

Select all true statements:
a) Dogs were the most common pet.
b) Fish were more common than birds.
c) There were 5 more cats than hamsters.
d) Dogs and cats together make 35 pets.
e) Birds were the least common.
f) Hamsters were owned more than cats.
A, B, D, E
400
Find the missing value.
Input: 59
Output:52
500
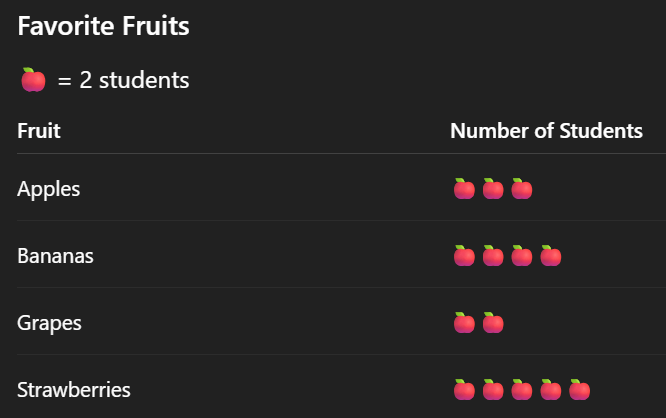
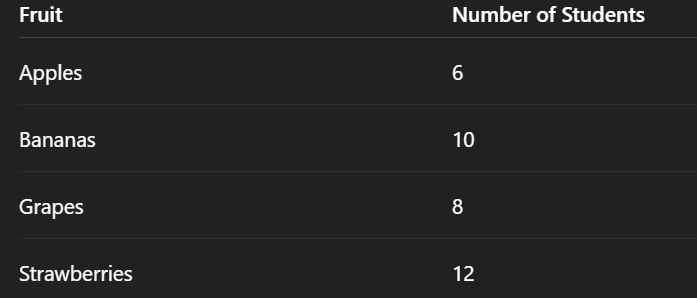
Select all true statements:
A. Strawberries were chosen by the most students.
B. Grapes were chosen by 4 students.
C. Apples were chosen by 2 more students than grapes.
D. Bananas were the least favorite fruit.
E. Bananas and apples together were chosen by 14 students.
F. 10 students chose strawberries.
A, B, C, F
500
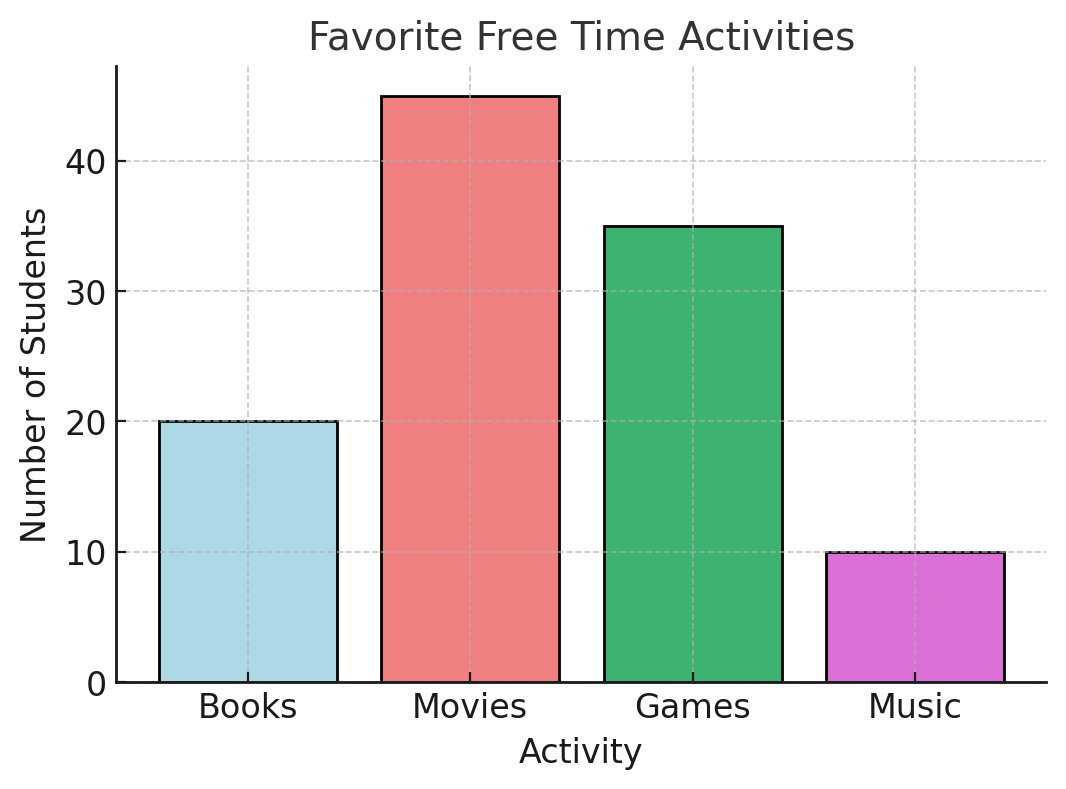
Select all true statements.
A. Movies were chosen by the most students.
B. Music was the least favorite activity.
C. 10 more students chose games than books.
D. Books and movies together were chosen by 55 students.
E. Music was chosen by more students than games.
F. Games were chosen by fewer students than movies
A, B, C, F
500
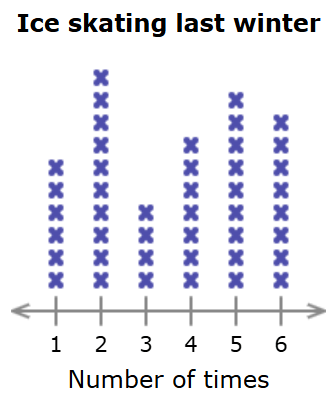
Select all true statements:
a) 7 students went ice skating 2 times.
b) More students went ice skating 5 times than 3 times.
c) One fewer student went 6 times than 5 times.
d) The fewest students went 3 times.
e) 4 students went ice skating 4 times.
f) No students went ice skating more than 6 times.
B, C, D, F
500
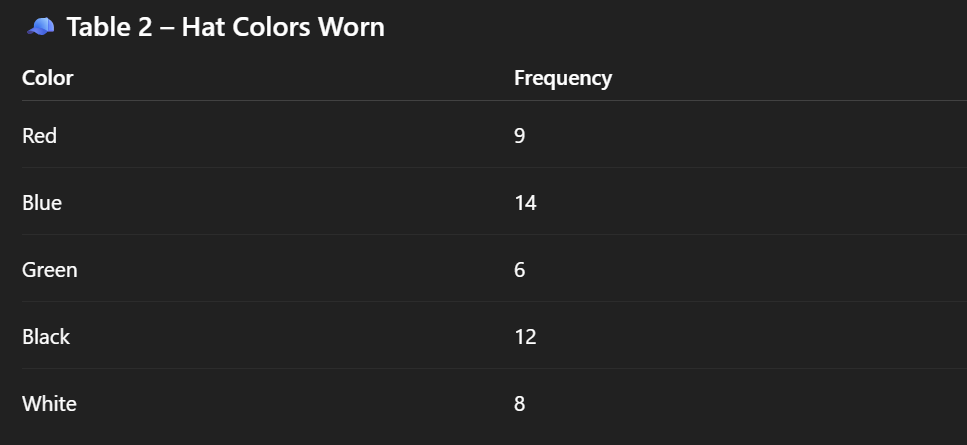
How many more blue and black hats were worn than green and white?
There were 12 more hats worn.
500
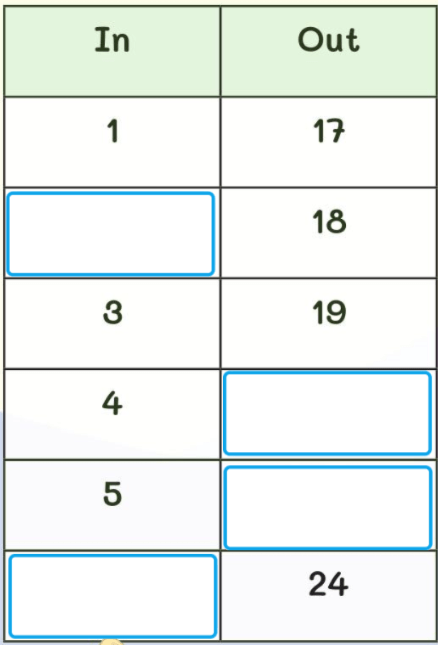
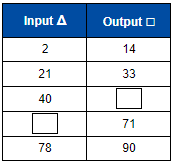
1) State the rule.
2) Find the missing values.
1) +16
2) 2, 20, 21, 24