Summaries
Graphing
Terminology
Code
Potpourri
100
Find the mode of this set:
{4, 7, 7, 7, 9, 9, 10, 11, 12}
7
100
What is the code to create a histogram of heights from the cdc data?
histogram(~height, data=cdc)
100
Give an example of a question that is NOT a statistical question.
(answers vary)
100
What does "mutate()" do in R?
It mutates a data set, perhaps by creating a new variable/column.
100
Who were your two substitute teachers when I was out in the fall?
Mr. Math, Mr. Pound
200
Find the median of this set:
{4, 7, 7, 7, 9, 9, 10, 11, 12}
9
200
What is the code to create a scatterplot of height as a function of weight from the cdc data?
xyplot(height~weight, data=cdc)
200
What are the four parts of the data cycle?
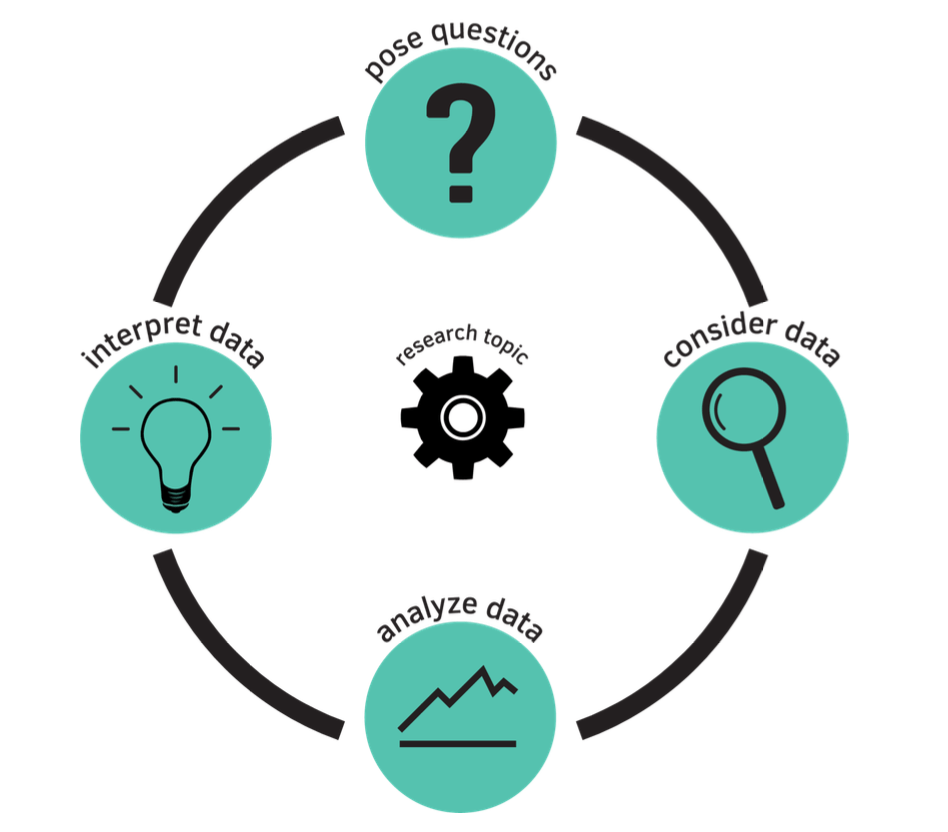
200
What does "set.seed()" do in R?
It takes the randomness out of a random process, making it replicable.
200
What was the treatment given to the experimental group in the Mythbusters episode we watched this year?
Someone yawned in front of them. (Statistical question: Is yawning contagious?)
300
Find the mean of this set:
{4, 7, 7, 7, 9, 9, 10, 11, 12}
76/9 or 8.4444444444...
300
What is the code to create this plot from the cdc data?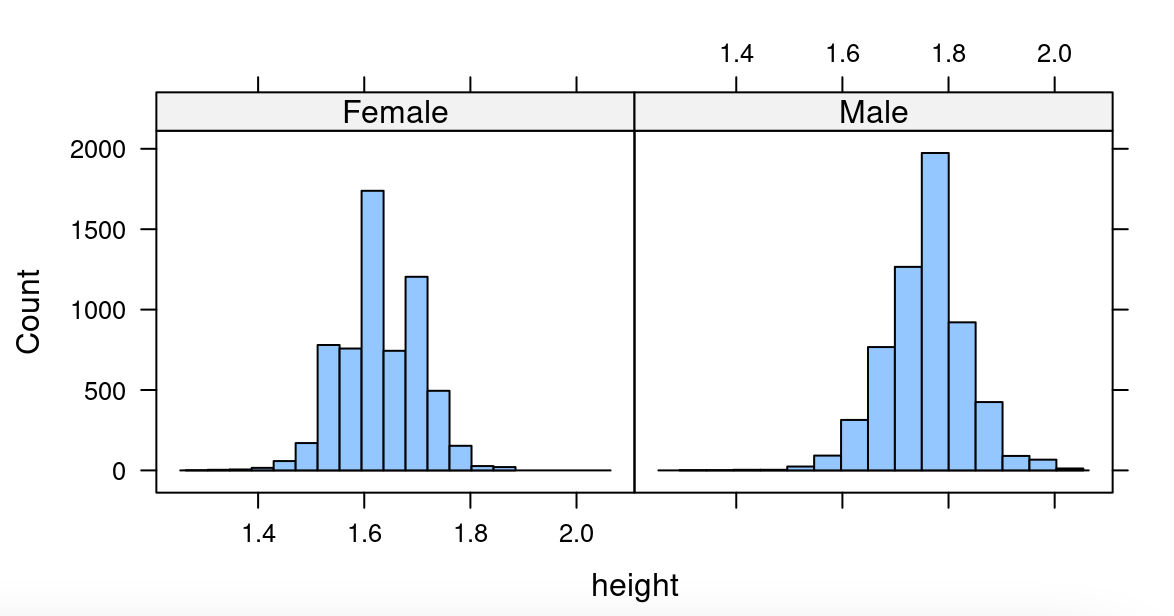
histogram(~height|gender, data=cdc)
300
What does MSE stand for?
Mean squared error
300
What does "str()" do in R?
It gives the structure of a data object, including things like the variable names and types.
300
Name the 6 classwide campaigns that we did this year.
food habits
personality color
stress and chill
time perception
time use
lunch
400
Find the IQR of this set:
{4, 7, 7, 7, 9, 9, 10, 11, 12}
3.5
400
What is the code to create this graph from the cdc data set?
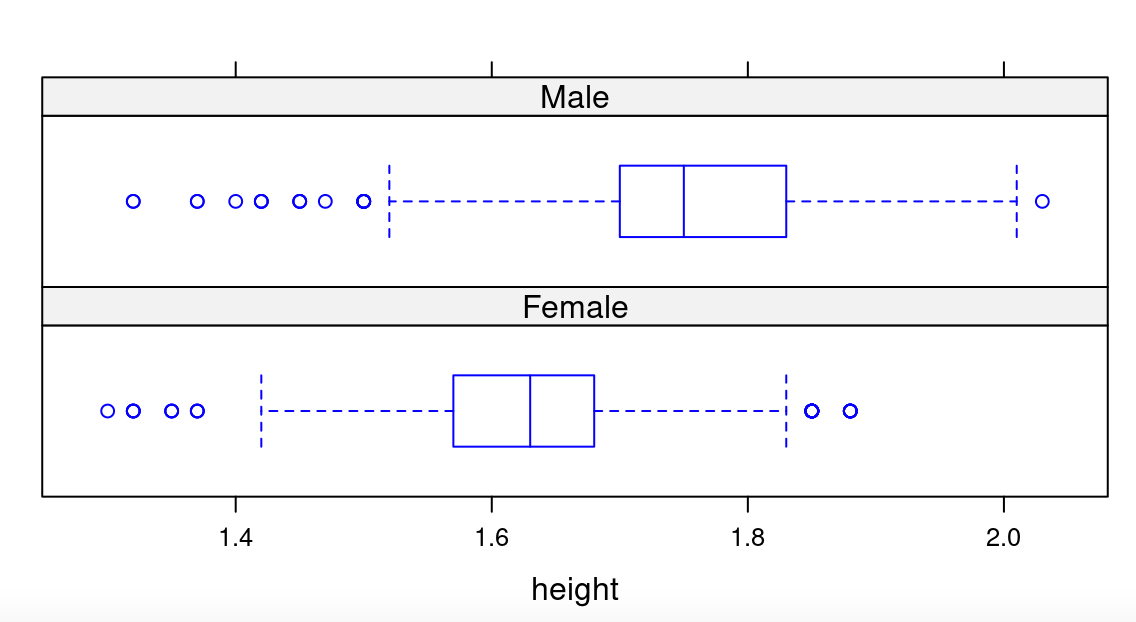
bwplot(~height|gender, data=cdc, layout=c(1,2))
400
What does it mean if the correlation coefficient between two variables is close to -1?
There is a very strong negative linear relationship between the variables.
400
What does "sample()" do in R?
It lets us take a random sample of values of a variable.
400
How many labs did we do this year?
31
500
Find the standard deviation of this set. (Answers within 10% of actual value are accepted.)
{4, 7, 7, 7, 9, 9, 10, 11, 12}
2.455. (range of accepted answers: 2.2095 - 2.7005)
500
What is the code to create this graph from the starwars data set? (Hint: the terms on the right are all species.)
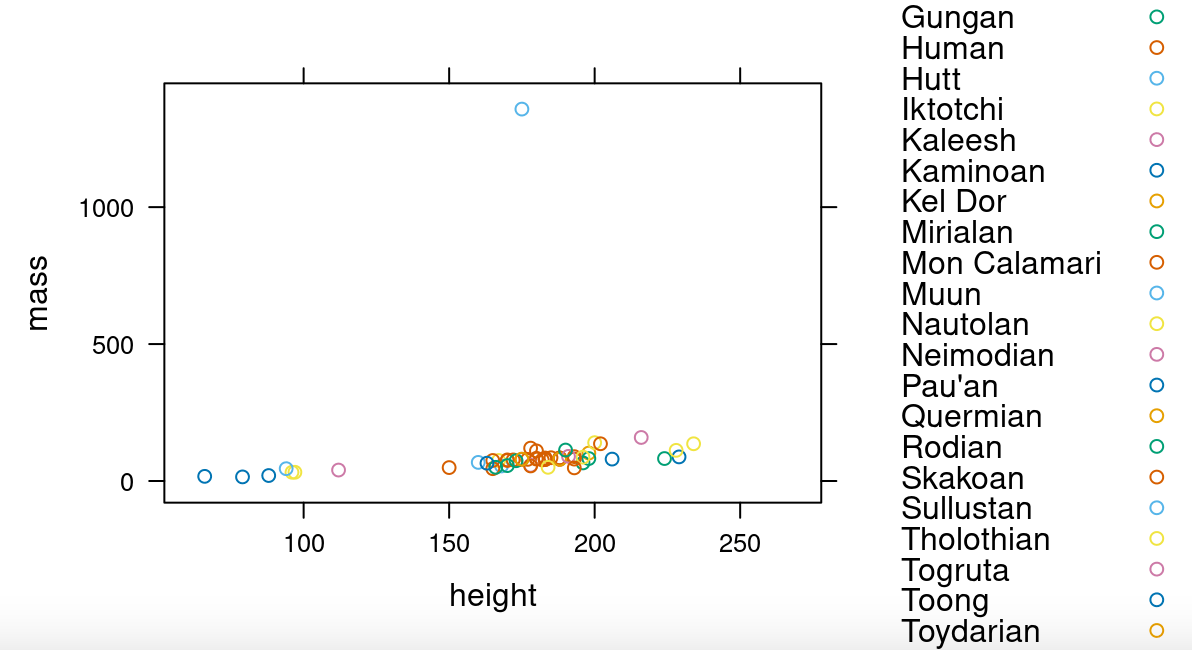
xyplot(mass~height, groups = species, data=starwars)
500
Give an example of when it might make sense to merge two data sets, and how you might do it using R.
(Answers vary)
500
The code "favstats()" generates 9 statistics. Name 8 of them. (Give the names of the statistics, not the numerical values)
min Q1. median Q3 max
mean sd n missing
500
What data science term rhymes with the name of an iconic Robin Williams character?
Outlier rhymes with Mrs Doubtfire!