Summaries
Graphing
Terminology
Code
Potpourri
100
Find the mode of this set:
{4, 7, 7, 7, 9, 9, 10, 11, 12}
7
100
What is the code to create a histogram of heights from the cdc data?
histogram(~height, data=cdc)
100
Give an example of a question that is NOT a statistical question.
(answers vary)
100
What does "mutate()" do in R?
It mutates a data set, perhaps by creating a new variable/column.
100
Who was your substitute teacher most often school this year?
A - Mr. Strope
D - Mr. Math
200
Find the median of this set:
{4, 7, 7, 7, 9, 9, 10, 11, 12}
9
200
What is the code to create a scatterplot of height as a function of weight from the cdc data?
xyplot(height~weight, data=cdc)
200
What are the four parts of the data cycle?
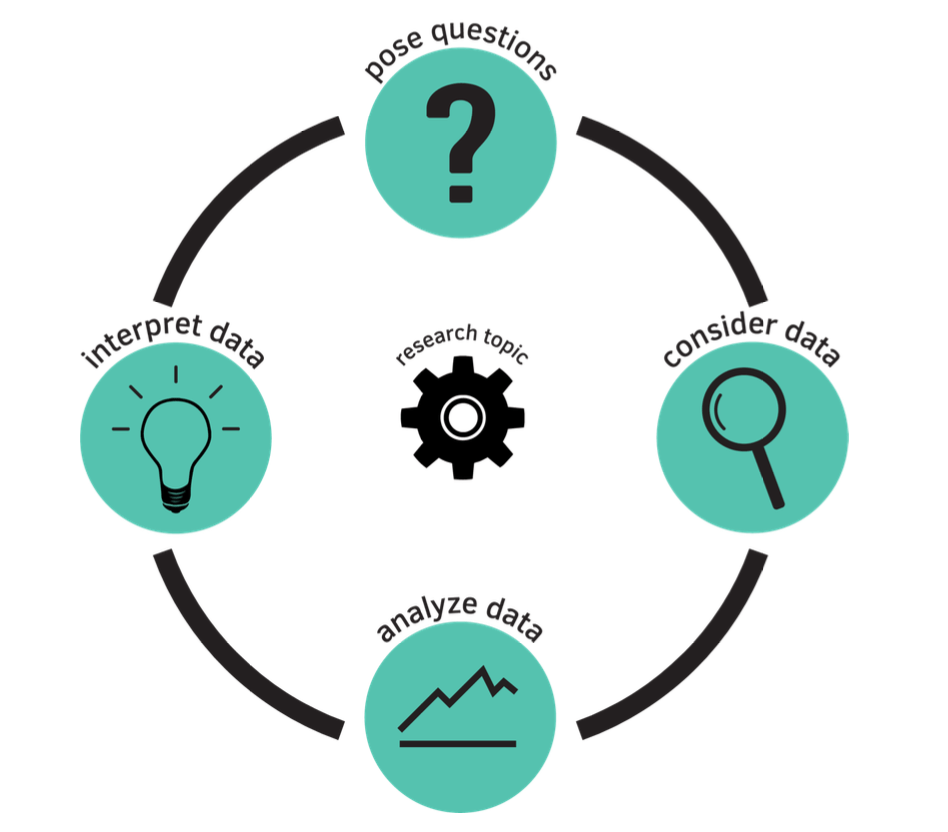
200
What does "set.seed()" do in R?
It takes the randomness out of a random process, making it replicable.
200
Where has Mr. Engelhart's daughter been for the past two weeks?
Germany
300
Find the mean of this set:
{4, 7, 7, 7, 9, 9, 10, 11, 12}
76/9 or 8.4444444444...
300
What is the code to create this plot from the cdc data?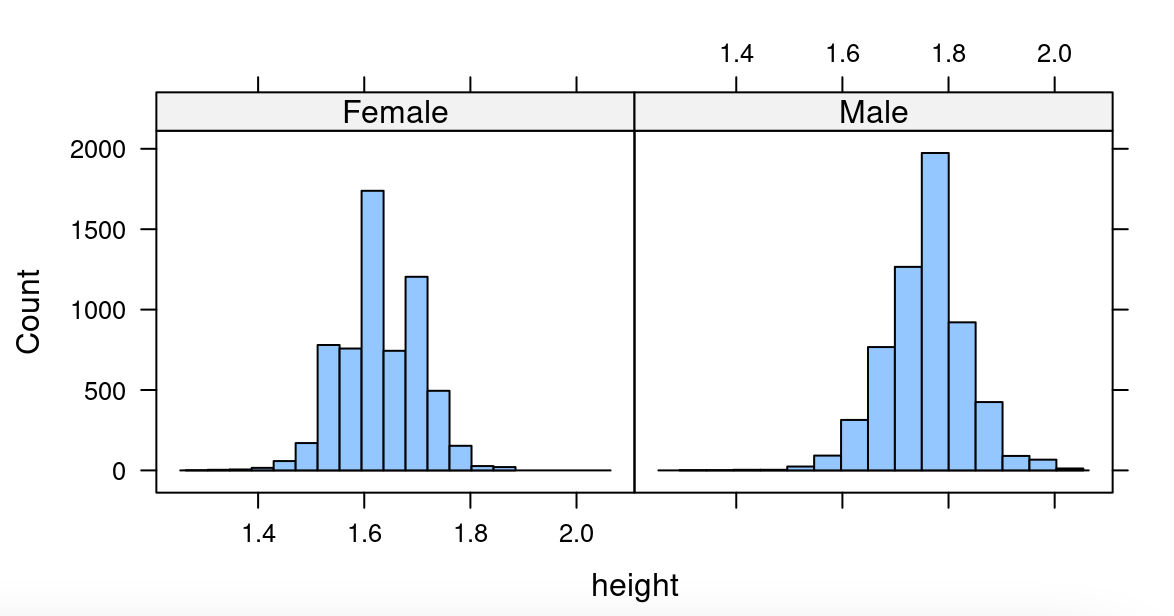
histogram(~height|gender, data=cdc)
300
What does SD stand for?
Standard deviation
300
What does "diff()" do in R?
It calculates the difference between to variable values
300
Name the 5 classwide campaigns that we did this year.
food habits
personality color
stress and chill
time perception
time use
400
Find the IQR of this set:
{4, 7, 7, 7, 9, 9, 10, 11, 12}
3.5
400
What is the code to create this graph from the cdc data set?
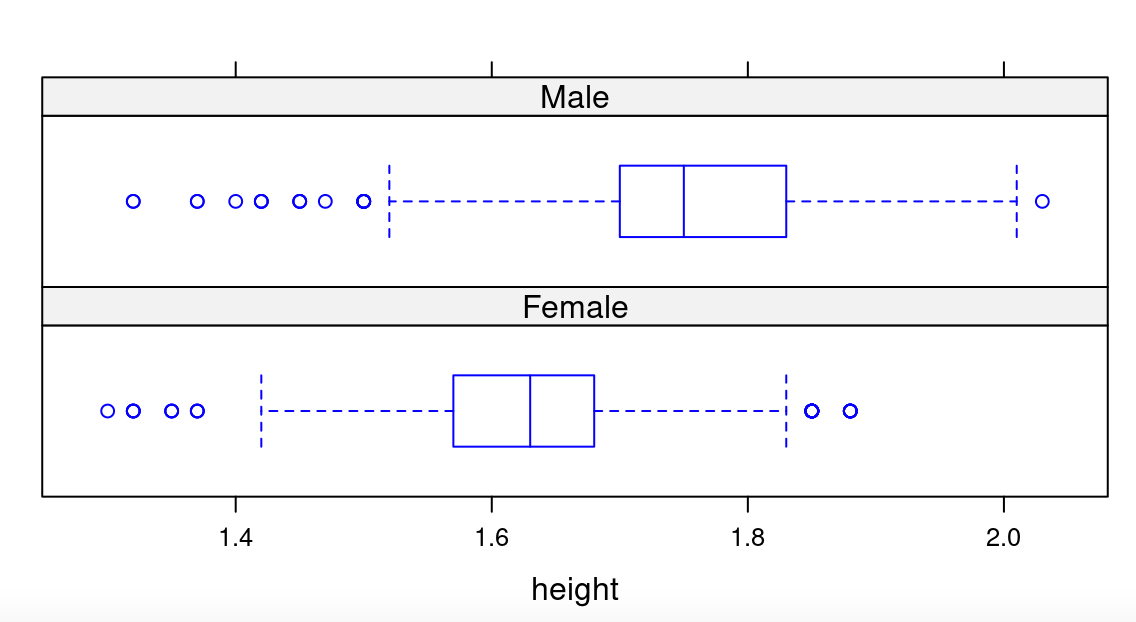
bwplot(~height|gender, data=cdc, layout=c(1,2))
400
What does it mean if the mean of a data set is more than 2 standard deviations from the simulation mean?
It did not occur by chance.
400
What does "sample()" do in R?
It lets us take a random sample of values of a variable.
400
How many labs did we do this year?
20
500
Find the MAD of this set. (Answers within 10% of actual value are accepted.)
{4, 7, 7, 7, 9, 9, 10, 11, 12}
1.95. (range of accepted answers: 1.9 - 2.0)
500
What is the code to create this graph from the starwars data set? (Hint: the terms on the right are all species.)
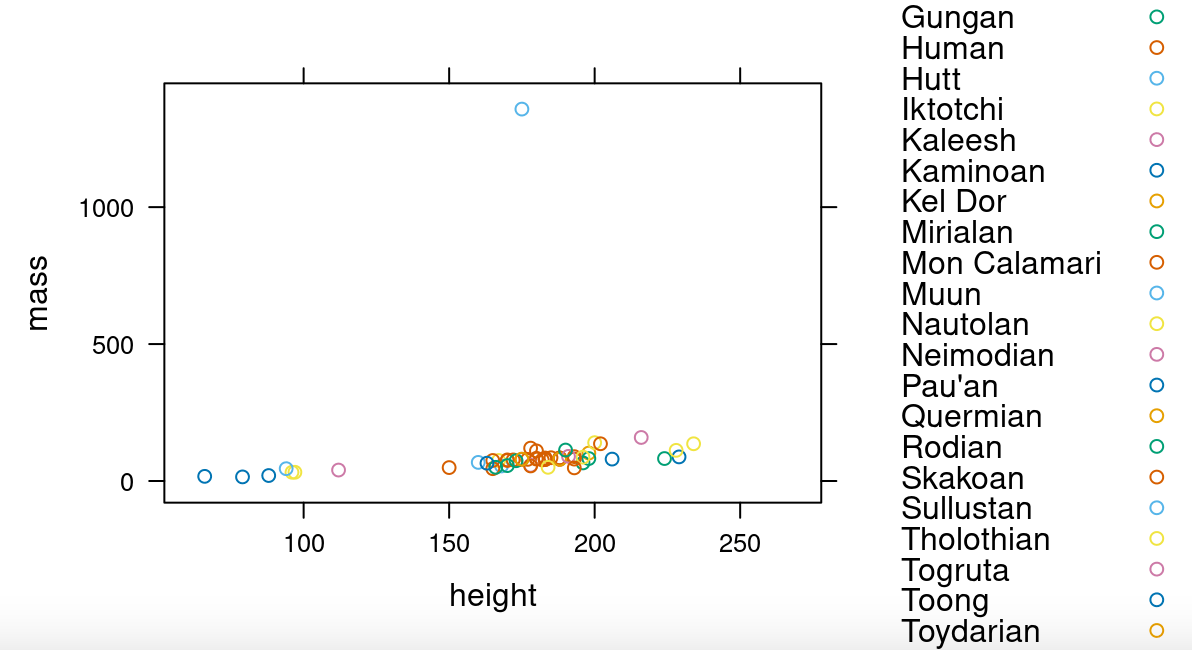
xyplot(mass~height, groups = species, data=starwars)
500
What is the function used to create a random simulation in R.
Shuffle
500
The code "favstats()" generates 9 statistics. Name 8 of them. (Give the names of the statistics, not the numerical values)
min Q1. median Q3 max
mean sd n missing
500
What two things are necessary for a statistical ivestigative question?
Data is required to answer it and the data must have variability.