Mean, Median, Mode, Range
Statistical/Non Statistical
Box Plots
Histograms
100
Jay plays tennis for his high school team. The table shows his practice times for one week. Determine the range.

What is 5
100
Describe what a statistical question is.
What is a question that can be answered by collecting data. Often, there will be variability in the data.
100
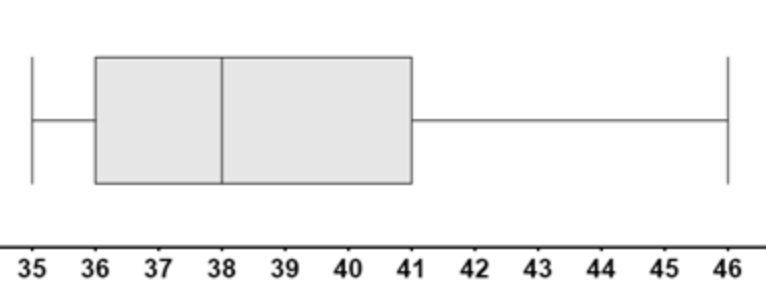
Find the five-number summary for the data below.
1. Minimum
5. Maximum
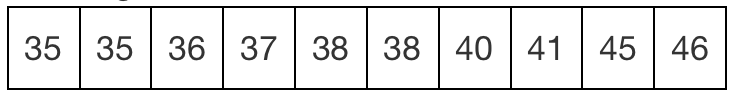
What is 35 minimum
What is 46 maximum
100
The histogram shows the wait-time for customers at a pizza restaurant to receive their orders. Which best describes the shape of the distribution?
Skewed Right, Skewed Left, Symmetric
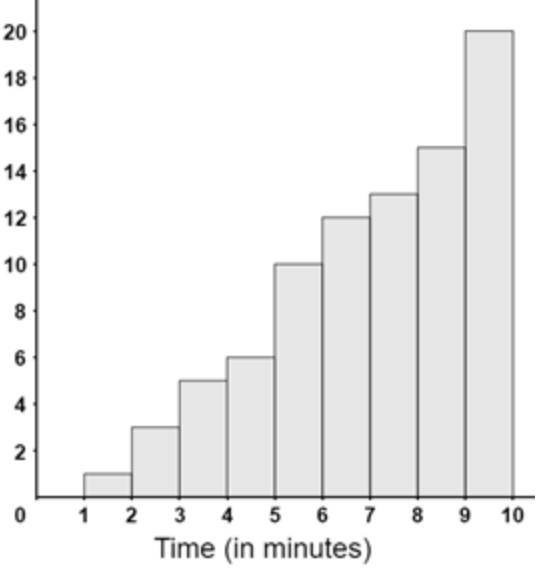
What is skewed left
200
Jay plays tennis for his high school team. The table shows his practice times for one week. Determine the mode.
What is 20
200
Describe what a non-statistical question is.
What is a question that can be answered by collecting data. There will be no variability in the data.
200
Find the five-number summary for the data below.
3. Median
What is 38
200
Describe what a cluster is.
What is when data points are in a close group or when numerical data have similar values on a number line.
300
Jay plays tennis for his high school team. The table shows his practice times for one week. Determine the mean.
What is 22
300
Create two questions that can classify as categorical and numerical.
What is "What is the cost of candy" answers will vary for numerical
What is "Types of pets that you have" answers will vary for categorical
300
Find the five-number summary for the data below.
2. Lower Quartile
4. Upper Quartile
What is 36 lower quartile
What is 41 upper quartile
300
Describe what a gap is.
What is where there is a location with no data values. On a histogram, a space between the bins indicate a gap, or a frequency of zero of that bin.
400
Jay plays tennis for his high school team. The table shows his practice times for one week. Determine the median.
What is 21
400
The table shows the question four different students wrote. Complete the statement (Bria, Gracie, Piper, Lola) did not write a statistical question because the question (is not numerical, is not categorical, does not have variability)
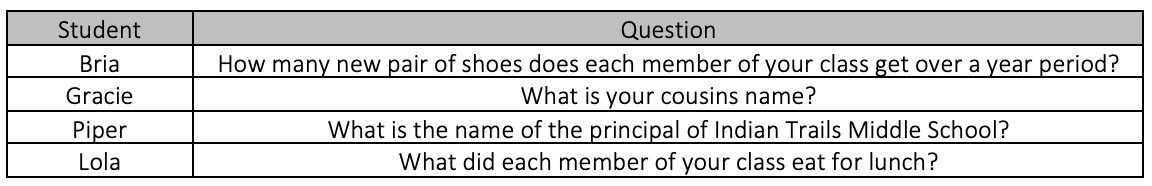
What is Piper
What is does not have variability
400
Once you find the five-number summary, create a box plot that represents the data accurately.
What is the correct box plot that represents the data accurately.
400
A histogram shows the times, in minutes, it took sixth-grade students to run mile.
The data has a gap between __________.
(50 to 150, 100 to 150, 150 to 250, 200 to 250, 250 to 400, 300 to 350)
Most of the data falls between __________.
(50 to 150, 100 to 150, 150 to 250, 200 to 250, 250 to 400, 300 to 350)
The data value 360 __________.
(is an outlier, is not considered an outlier)
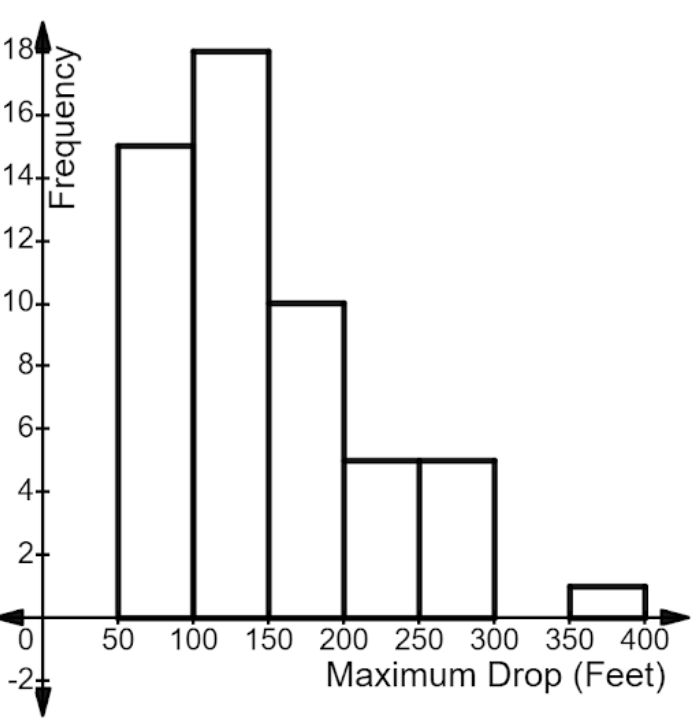
What is 300 to 350
What is 50 to 150
What is not considered an outlier