Measures of Center/Variability
Data Displays
Comparing Data
Conceptual
100
Find the mode for the set of data: 5, 4, 3, 6, 3, 7, 2, 8, 4, 6, 3, 7, 8
3
100
Create a dot plot to represent the number of fouls committed by each player.
4, 2, 2, 1, 1, 3, 5, 1, 5, 1, 2
HINT: The numbers are indicating which player committed the foul (ex: player 4 committed the first foul). Make the x-axis the player number and the y-axis the frequency of fouls commited by the corresponding player.

100
Based on the dot plots, do those surveyed spend more time exercising or playing video games? 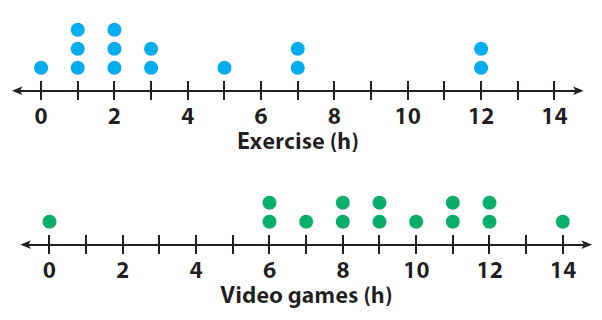
They spend more time playing video games.
100
What is a population?
A small group of the population.
200
Find the range for the set of data: 4, 7, 9, 2, 6, 3, 11, 4, 6, 3, 8, 7
9
200
Find the interquartile range for the data and explain how you found it.
2, 4, 5, 5, 6, 7, 8, 9, 10, 10, 11, 12
The interquartile range is 5. You subtract Q1 (5) from Q3 (10) to get 5.
200
Which dot plot has a wider range?
Video games
200
TRUE OR FALSE: A sample should have as much bias as possible in order to be fair.
FALSE
300
Find the median for the set of data: 4, 8, 7, 3, 2, 9, 8, 5, 3, 8
6
300
The middle 50% of the data fell between which test scores?

Between 78% and 93%. (answers may vary slightly)
300
Which class had the more consistent performance on their test based on the box plots? Why?
Wait for picture...
2nd period was more consistent because they had both a smaller range and a smaller interquartile range.
300
Name three types of charts or graphs used to organize data.
Bar chart, dot plot/scatterplot, histogram, box plot, pie chart, etc
400
Find the mean for the set of data: 51, 84, 39, 52, 76, 29, 93, 87
511/8 or 63.875 or 67 7/8
400
Based on the histogram, which height range had the greatest frequency? (HINT: Each bar shows a range, so your answer should be one of these ranges Ex: 60-65).
75-80 feet
400
Compare the prices from the two restaurants.
Wait for the picture...
The Red Brick Grill has a wider range of prices. They also have the cheapest and most expensive prices.
400
What are the three rules of a statistical question?
1. Must have a different answer depending on who you ask.
2. Must address a group or population.
3. Must not rely on a single, fixed fact.
500
Find the mean for the set of data: 120, 129, 157, 218, 192, 20, 201, 187, 17, 213
145.4
500
How many people fell between the ages of 40-70? 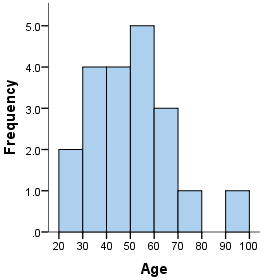
12 people
500
Who has a higher average/mean?
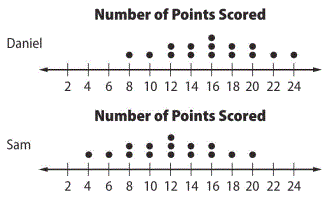
Daniel
500
Give me THREE statistical questions.
Answers may vary.