Randomness & Bias
M & M & M
Graph it!
Number Cruncher
Trendy Trends
100
“Do you think that soothing classical music is more pleasing than the loud, obnoxious pop music that teenagers listen to?”
What is bias?
100
The value that appears the most
What is the Mode
100
A table that lists each item in a data set and shows a tally mark for each time the item appears.
What is a Frequency table?
100
A zookeeper created the following stem-and-leaf plot showing the number of tigers at each major zoo in the country:
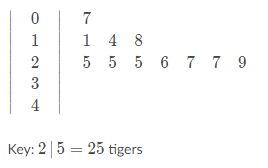 This is the mode of tigers at the zoos.
What is 25?
100
What is positive?
200
“Which do you think is the most common age group of people who like pop music?”
What is unbiased?
200
The middle value when a set of data is arranged in order
What is the Median
200
A data display that groups the values in a data set by their digits to show how the values are distributed.
What is a Stem-and-Leaf Plot?
200
The boys and girls basketball teams at a high school had their heights measured at practice. The following data was recorded for their heights (in centimeters):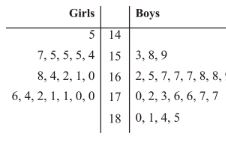 The total range of heights is this.
What is 40?
200
Carmella made a scatter plot comparing the daily temperature and the number of people at a beach. The scatter plot below that most likely represents the data.
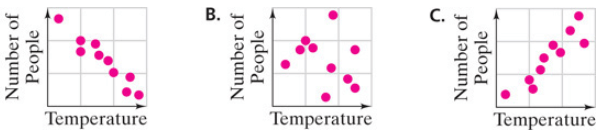
What is C?
300
Encourages a certain response by the wording of a question, or by selecting a specific group to ensure desired outcome.
What is Bias
300
The number 5 represents what type of measure when the following numbers are used... 6,5,4,7,4,6,3
What is the Mean
300
A graph that uses a number line to show the frequencies of data values.
What is a line plot?
300
This makes the graph misleading.
What is the scale on the y axis?
300
As one value increases, the other tends to decrease .
What is a negative trend?
400
You ask the first 20 seventh-graders who arrive at a soccer game, “Is soccer your favorite sport to watch?”
What is not random, and unbiased?
400
The sum of the values divided by the number of values in a set
What is the Mean
400
When showing continuous data, as in changing gas prices over time, this type of graph would be the most appropriate.
What is a line graph?
400
The estimated the total deer population is this for year 2.
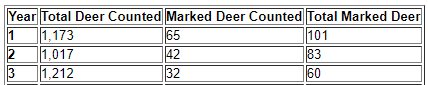
What is about 2,010 deer?
400
A tree is 28 years old. The estimate its diameter. 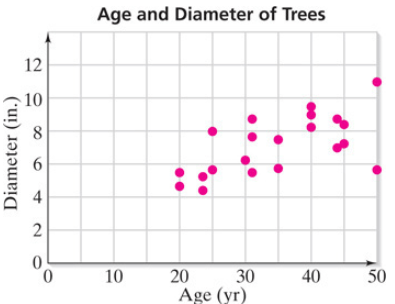
What is 6 inches?
500
A more random way to survey teens about their snacking habits.
- You ask people at a party to name their favorite snack.
- You ask several teens entering a grocery store.
What is ask several teens entering a grocery store?
500
It is calculated by finding the mean of the absolute values of the differences between each data value and the mean of the set.
What is MAD (mean absolute deviation)?
500
A type of bar graph with no spaces between the bars. Each bar in the graph represents an interval of values. The height of the bar shows the frequency of the values in its corresponding interval.
What is a histogram?
500
The MAD of
3, 6, 6, 7, 8, 11, 15, 16
What is 3.75?
500
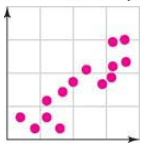
An international cake competition attracted 50 bakers from around the world. The graph shown below displays the relationship between the amount of sugar in the cakes (in grams per 100 grams of cake) and the scores the cakes received.
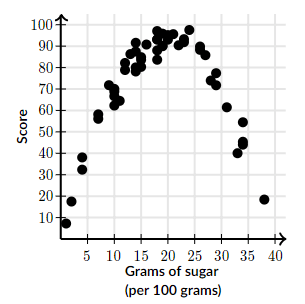 This amount of sugar earns the highest score.
What is 15-25 grams of sugar per 100 grams of cake?