What is a variable?
Anything that you can change in an experiment that might affect the outcome.
What type of graph shows the outcome of a series of experiments when a variables is changed incrementally?
Two-Coordinate Graph
 What is the relationship of this graph?
As the time increases, so does the distance.
Why is important to make sure that all variables are being controlled except for one?
If you do not control all but one variable then you will not know which one is impacting the results.
Where are the independent and dependent variables graphed?
IV= X-axis
DV= Y=axis
What is the basic procedure used in a controlled experiment before changing any of the variables?
Standard
What is the independent variable for this graph?
Capacity of the boat.

What is the relationship of this graph?
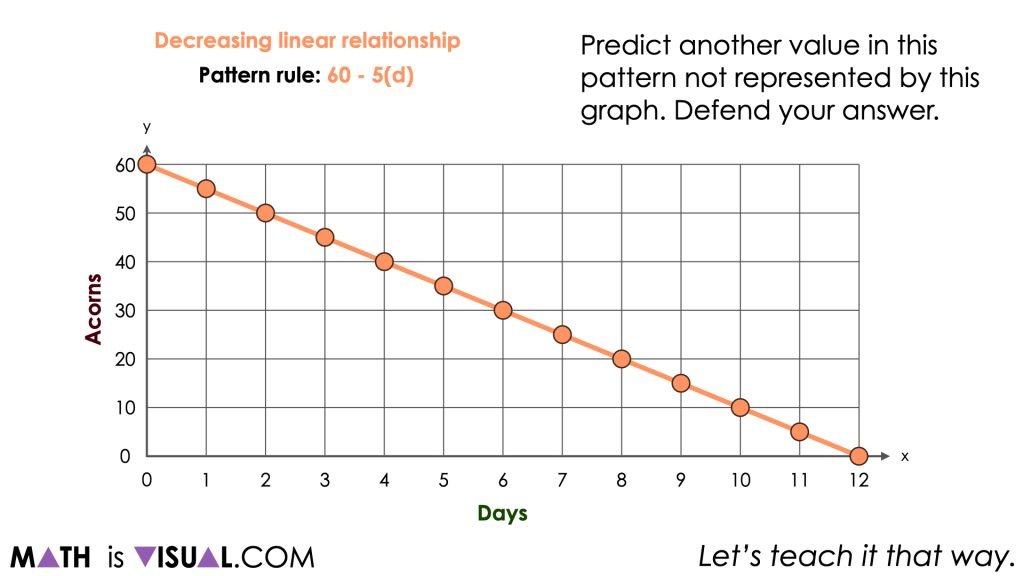
As the days increase the acorns decrease.
Some students wanted to test how the amount of soil would impact the height of the plant. They put different amounts of soil in three different pots. In those pots they placed 6 sunflower seeds, 4 rose seeds, and 3 tulip seeds. They concluded that the more soil you give a plant the higher it will grow. How can this experiment be improved?
Test same plant. Same amount of seeds. Multiple trials. Make sure each plant gets the same resources.
Which variable is found out by doing the experiment?
Dependent
What is a controlled experiment?
An experiment in which all of the variables are controlled except the one being tested.
What is the dependent variable for this experiment?
Number of passengers
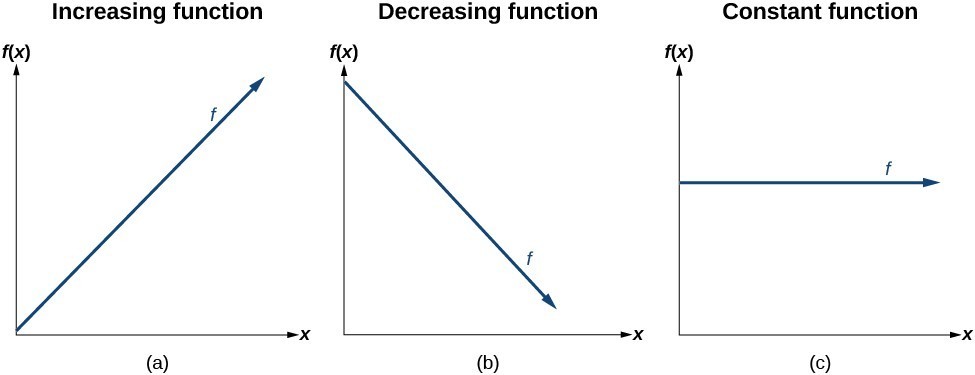
 Which of these graphs would show the relationship that the more sunlight you give a plant the higher it grows?
The first one.
A teacher wants to know which fruit would make the students study more: apples or oranges. The teacher sets up an investigation. During science class, the teacher gave each student one apple and recorded how much they studied. After writing class, the teacher gave each student one orange and recorded how much they studied. The teacher then analyzed the results and formed conclusions based on the data. How can this experiment be improved?
Make sure to test at the same point of the day. Know what other food was eaten that could impact the results.
What is the independent variable?
The variable that is being changed or tested.
What does it mean to control a variable?
Keep it constant.
Using the graph, predict the capacity of a boat that can fit 25 passengers.
42-43mL

Which of these graphs shows the relationship that the more time you spend on your phone the less sleep you get?
The second one.
A group of students wanted to test out which phone got the best reception. One student had their I-phone out next to the router. The next student had their Samsung out in the basement. The next student had their Blackberry out on an airplane. The results were that the I-phone had the best wifi connection. Do you agree? Why?
No. They need to test the phones out in the same place.
A student wanted to do an experiment to see if light makes a glass of water warmer. As soon as it got dark, he put one glass outside and put the other in the kitchen with the light on all night. Outside, the temperature was 32 degrees. Inside, the temperature was 65 degrees. When the student checked the glasses the next morning he found that the glass on the inside was warmer. He concluded that light makes water warmer. Do you agree with the student? If yes, why? If no, why?
No. The student did not control all of the variables. He needed to make sure that both glasses were put into environments with the same temperature. The glass inside was in an environment where it was already warmer.
What three things can be done in an experiment to improve the accuracy?
Control all variables except the one being tested. Multiple trials. Use smaller units of measurement.
Predict the max amount of passengers a 30mL boat would hold.
16-18

The temperature in a room with no windows is set to 72 degrees. What would the relationship on the graph be if you checked the room every hour to see what the temp was?
The third graph.
Which two pendulums could be used to find out if the variable of length impacts the number of swings? Why?
A. 15 cm, fishing line, washer. 15 cm, string, washer.
B. 15 cm, fishing line, washer. 45 cm, fishing line, washer.
C. 45 cm, string
B. because they are different sizes, but the rest of the materials are the same.
What is the part of the lightbulb that produces light?
The filament?