Categorical
Definitions
Stem And Leaf
Dot Plot
Graphs and Plots
100
The most common score of a data set.
Mode
100
 What is the range?
66 - 1 = 65
100
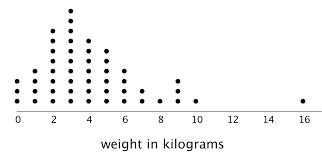
What do the dots represent?
Rating of Internet Cats
100

What type of graph is this?
Picture Graph
200
What is an outlier?
An extreme score that is very different from the other scores in a data set.
200
Which side are the tens? Which side are the ones?
Tens are on the left. Ones are on the right.
200

How many people were surveyed?
50 people
200
 What type of graph is this?
Divided bar graph
300
How do I find the mean?
Divide the sum of scores by the number of scores
300
How many people were surveyed?
47
300
What is the range?
9
300
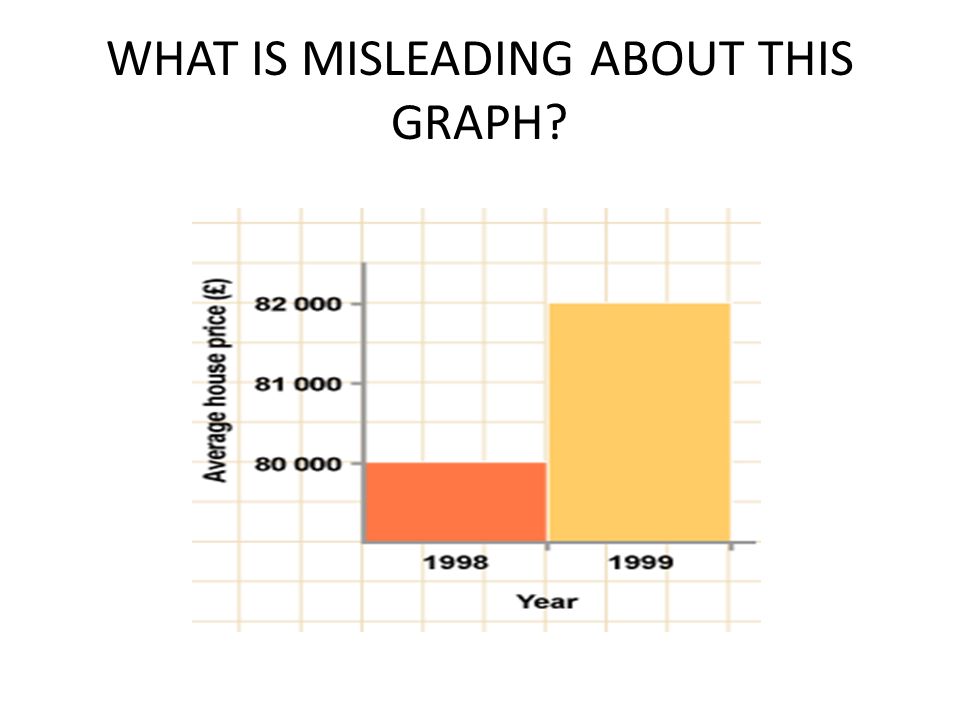
It only shows part of a scale. The scale is not regular and does not start at 0. It makes the average price difference much larger.
400
How do you find the median?
First arrange numbers smallest and largest. Then cross out scores in pairs of smallest and largest score. The median is either the last score remaining or a sum of the two scores divided by 2.
400
What is the median?
32
400
What is the median?
8
400
Draw a dot plot to represent the following:
A survey of "How long does it take you to eat breakfast?" has these results:
Minutes:0 1 2 3 4 5 6 7 8 9 10 11 12
People: 6 2 3 5 2 5 0 0 2 3 7 4 1
(i.e. 6 people spent 0 minutes)

500
How do you construct a stem-and-leaf plot? Use a diagram to illustrate your definition.
Construct two columns. The one of the left is the stem and is used to represent the "tens". The one of the right is the leaf and is used to represent the "ones".
500
What is the mean (2 dec pl)?
27.43478.. = 27.43
500
What is the mean?
7.44
500

Which team performed better? Team Seattle or Team Chicago? Why?
Mean(Seattle) = 12.5
Mean(Chicago) = 12.43
Seattle performed slightly better as it has a higher mean.