Vocabulary
Linear Models
Using Linear Models in a Data Context/Association
Two-Way Tables
100
A variable that is predicted (response variable).
What is a Dependent Variable?
100
Identify a possible numerical independent variable that might be used to predict the fuel efficiency (in miles per gallon) for a car.
What is...
-Weight of the car? Or
-Size of the car's engine?
100
What axis does the independent variable go on?
x-axis
100
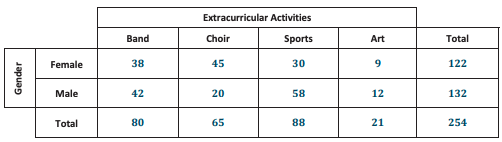
Every student at Abigail Douglas Middle School is enrolled in exactly one extracurricular activity. The school counselor recorded data on extracurricular activity and gender for all 254 eighth-grade students at the school. The counselor’s findings for the 254 eighth-grade students are the following:
Of the 80 students enrolled in band, 42 are male.
Of the 65 students enrolled in choir, 20 are male.
Of the 88 students enrolled in sports, 30 are female.
Of the 21 students enrolled in art, 9 are female.
Complete the table.
200
A variable that is the predictor (explanatory variable).
What is an Independent Variable?
200
Identify a possible numerical dependent variable for the independent variable, age of a student.
What is...
-time it takes a student to run a mile
-height of the student
-grade level of the student
200
If you wanted to be able to predict population size in a given year, which variable would be the independent variable and which would be the dependent variable?
Population size (dependent variable) is being predicted based on year (independent variable).
200
Write a sentence explaining the meaning of the frequency 38 in this table.
The frequency of 38 represents the number of eighth-grade students who are enrolled in band and are female.
300
Data with one variable.
What is Univariate Categorical Data?
300
Use numbers to write a linear model for this description.
Total Monthly Cost=40 dollars plus number of text messages, multiplied by 15 cents.
y= $40 + 0.15x
300
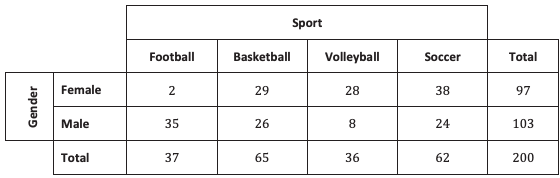
This table summarizes the results of the survey data for the two variables, gender and which sport the students prefer to play. Is there an association between gender and which sport the students prefer to play? Explain.
Yes, there appears to be an association between gender and sports preference. The row relative frequencies are not the same for the Male and the Female rows, as shown in the table above.
300
What proportion of students are male and enrolled in choir?
0.08 or 8%
400
Data with two variables.
What is Bivariate Categorical Data?
400
The Mathematics Club at your school is having a meeting. The advisor decides to bring bagels and his award winning strawberry cream cheese. To determine his cost, from past experience he figures 1 bagels per student. A bagel costs 65 cents, and the special cream cheese costs $3.85 and will be able to serve all of the anticipated students attending the meeting.
Find an equation that relates his total cost to the number of students he thinks will attend the meeting.
y=$0.65x+$3.85
or
y=$3.85+$0.65
400
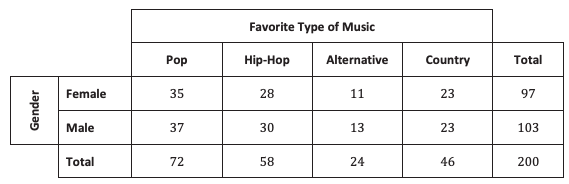
This table summarizes the results of the survey data for the two variables, gender and favorite type of music. Is there an association between gender and favorite type of music? Explain.
No, there does not appear to be an association between gender and favorite type of music. The row relative frequencies are about the same for the Male and Female rows, as shown in the table above.
400
What proportion of students are enrolled in a musical extracurricular activity (i.e., band or choir)?
0.57 or 57%
500
The frequency divided by a total.
What is Relative Frequency?
500
The rate of change and the initial value in the equation
y=4500+252x.
What is 252 (rate of change) and 4500 (initial value)?
500
Find the equation of the line using these two points (1992, 10.01) (2004, 9.86).
y= -0.0125x + 34.91
or
y= 34.91 - 0.0125x
500
What proportion of students enrolled in sports are male?
0.66 or 66%