Linear Functions
Roots, Rational Numbers, and Irrational Numbers
Functions and Linearity
Transformations
Scatter Plots
100
Isaac uses the equation y = 20,000 – 375x to determine the approximate amount of student loan debt he has left, y, where x is the number of months. What is the meaning of the slope in the linear model?
A.) Isaac’s monthly student loan payment is about $20,000.
B.) Isaac’s monthly student loan payment is about $375.
C.) Isaac has about $20,000 in student loans.
D.)Isaac has about $375 in student loans.
B.) Isaac’s monthly student loan payment is about $375.
100
Which choice is an irrational number?
sqrt(121)
sqrt(100)
sqrt(64)
sqrt(47)
sqrt(47)
100
In which set of ordered pairs is y a function of x?
A.) {(3, 1), (4, 5), (3, 2), (4, 8)}
B.) {(2, 5), (1, 7), (0, 2), (1, 10)}
C.) {(2, –4), (5, –4), (7, 4), (10, 4)}
D.) {(–3, 2), (3, –2), (3, 2), (–3, –2)}
C.) {(2, –4), (5, –4), (7, 4), (10, 4)}
100
What kind of transformation is shown below?
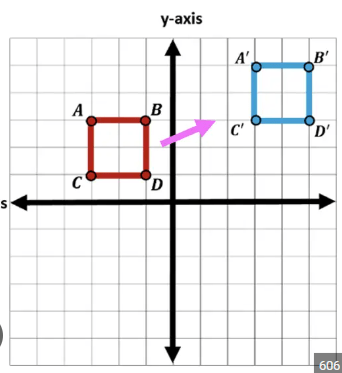
A) rotation B) reflection
C) translation D) dilation
C) translation
100
Which choice BEST describes the relationship between the variables shown in the graph below?
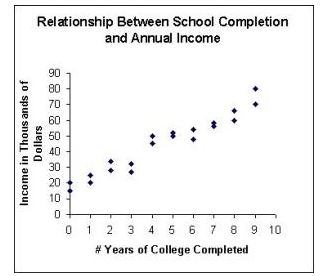
A. People who completed more years of college generally made less money than those who completed fewer years of college.
B. There is no relationship between college completion and income.
C. The annual income is the same regardless of the number of years of college completed.
D. People who made more money generally completed more years of college than those who made less money.
D. People who made more money generally completed more years of college than those who made less money.
200
What is the rate of change of the linear function that has a graph that passes through the points (4,-4) and (8,-6)?
-1/2
200
The value of the number below is closest to what positive integer?
sqrt(48)
7
200
In which equation is y a nonlinear function of x?
y = (7x)/x - 4
y = 3/4x+5
y = 2/3x^2
y = x/4
y = 2/3x^2
200
Tim draws a rectangle on a coordinate plane with vertices at Q(2, 4), R(2, 7), S(6, 7), and T(6, 4). Tim reflects the rectangle across the x-axis. What are the coordinates of rectangle Q′R′S′T′?
A.) Q′(–2, 4), R′(–2, 7), S′(–6, 7), T′(–6, 4)
B.) Q′(–4, 2), R′(–7, 2), S′(–7, 6), T′(–4, 6)
C.) Q′(2, –4), R′(2, –7), S′(6, –7), T′(6, –4)
C.) Q′(2, –4), R′(2, –7), S′(6, –7), T′(6, –4)
200
A scatterplot with a linear model is shown. Which statement best describes the linear model?
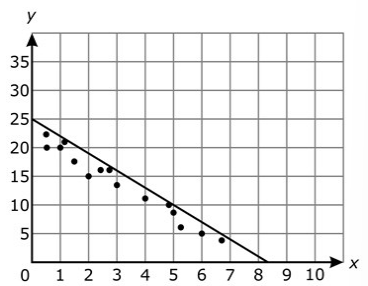
A. The linear model describes the data well because all of the points are below the line.
B. The linear model describes the data well because the points are not in a straight line.
C. The linear model does not describe the data well because the points are not in a straight line.
D. The linear model does not describe the data well because the points are not scattered above and below the line.
D. The linear model does not describe the data well because the points are not scattered above and below the line.
300
A line is shown on the graph
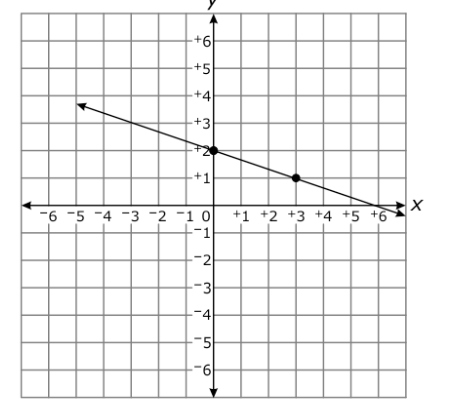
Which equation represents the line on the graph?
y=-1/3x+2
y=1/3x+2
y=-2x-1/3
y=2x+1/3
y=-1/3x+2
300
What is the value of x in the equation x3 – 9 = 18?
3
300
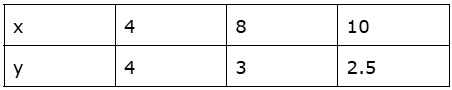
A table with missing values is shown.Which ordered pair would make the data in the table a function?
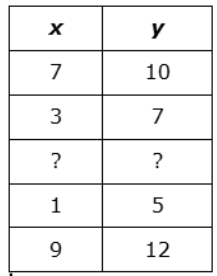
A.) (1,8)
B.) (2,7)
C.) (7,4)
D.) (9,6)
B.) (2,7)
300
△XYZ with vertices X(1, 1), Y(3, 5), and Z(5, 1) will be rotated 180° about the origin. What will be the coordinates of Y′?
A (–5, 3) B (–3, –5)
C (5, –3) D (5, 3)
B (–3, –5)
300
This scatterplot shows the cost to buy snacks at a baseball game. The equation for the linear model is y = x.

Which statement is true?
A.)The y-intercept represents the cost for admission to the baseball game.
B.) The y-intercept represents the cost to buy 0 snacks.
C.) The slope represents $2 per snack.
D.) The slope represents $4 per snack.
B.) The y-intercept represents the cost to buy 0 snacks.
400
A linear function is represented by the table below.
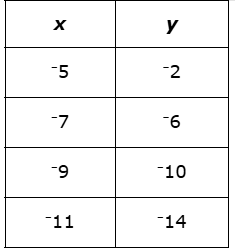
Which equation represents the linear function?
A.) y = –4x + 2 B.) y = –2x + 4
C.) y = 4x – 2 D.) y = 2x – 4
C.) y = 4x – 2
400
A number line is below.
Which choice is approximately located at point M?
pi
pi-1
sqrt(6)
sqrt(8)
sqrt(8)
400
10.) Ralph walked along a straight path at a constant speed, from his school to a nearby park.
When he arrived at the park, he sat down on a park bench to rest for a while.
Then he walked back to the school along the same straight path, but at a faster constant speed than he had used while walking to the park.
Which graph represents this situation?
A.) 


A.)
400
△LMN will be dilated with respect to the origin by a scale factor of 1/2.
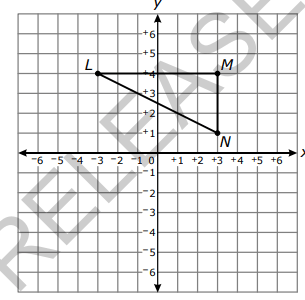
What will be the coordinates of △L′M′N′?
A L′(–6, –8), M′(6, 8), N′(6, 1)
B L′(–3, 2), M′(3, 2), N′(3, 0.5)
C L′(–1.5, 2), M′(1.5, 2), N′(1.5, 0.5)
D L′(–1, 2), M′(1, 2), N′(1, 1)
C L′(–1.5, 2), M′(1.5, 2), N′(1.5, 0.5)
400
This scatterplot shows the relationship between the height of kites and wind speed.
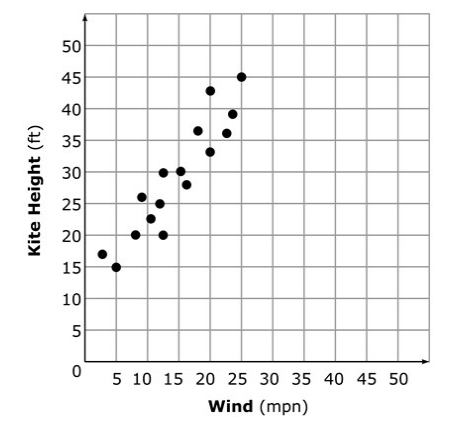
Which equation best fits the data?
A. y = -x – 15 B. y = -x + 15
C. y = x – 15 D. y = x + 15
D. y = x + 15
500
Which function has a larger y-intercept, and how much larger is it?
Function A: y= - 2/5x + 7
Function B:
Function A has a y-intercept that is 2 larger than the y-intercept of Function B
500
The area of a square is 64 in2. What is the perimeter of the square?
32 in
500
Which scenario below would most likely represent a function? (Assume the first term is the input and the second term is the output).
A ) Shoe company -> shoe model
B ) Person -> primary home address
C ) Teacher -> student enrolled in class
D ) Author -> book they have written
B ) Person -> primary home address
500
A triangle is shown.

Triangle EFG is rotated 270° counterclockwise about the origin. What is the x-coordinate of G′?
A.) -5 B.) -2 C.) 2 D.) 5
A.) -5
500
9.) A scatterplot is shown.

Which equation best models the data in the scatterplot?
A.) y = x + 50 B.) y = x + 60
C.) y = 5x + 50 D.) y = 5x + 60
C.) y = 5x + 50