Identifying Slope
Equations
Challenge
True or False
Which point is it?
100
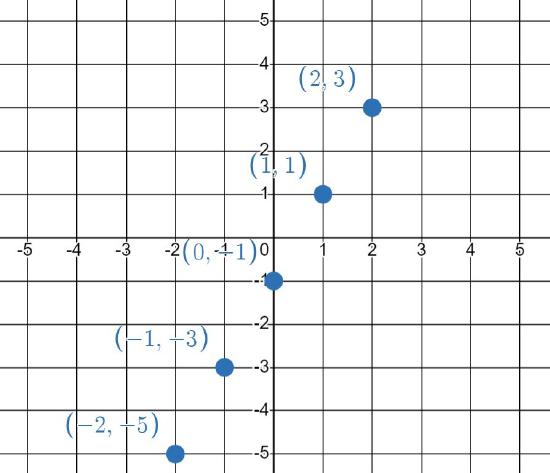
The slope of the EQL
What is 2x?
100
The y-intercept equation of this regression line
What is y=x
100

This dotted EQL is rerresented by the inequality y<-1/2x-1. The leaf of this rose fits completely, partially, or not at all into this side of the graph.
What is not at all?
100
This graph represents a positive distribution
What is True?
100
The coordinates of the point on the y-axis (Hint: this point gives the y-intercept of the EQL)
BONUS: The y-intercept equation of the regression line shown (rounded to the nearest tenth)
What is (0, 2)?
BONUS ANSWER: What is y=-0.1x+5.4
200
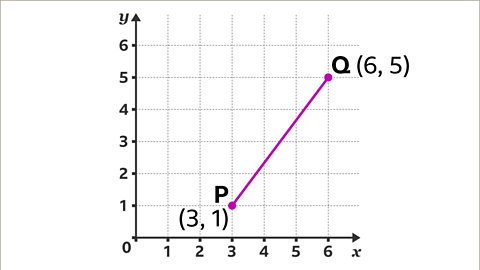 The slope of this line
What is 4/3x?
200
y-intercept equation of the EQL shown
What is y=-x+5
200

Imagine these two EQLs in a system, would the point (1,2) work in both equations?
BONUS: Would this system be a no solution, one solution, or infinetely many solution system?
What is no/false?
BONUS ANSWER: What is a one solution system?
200

True or False:
The image represents a positive graph
What is True?
200
This is a positive graph representing the relationship between price and production.
The cost at around 1.3K units of production based on the given regression line. (dollars rounded to the nearest hundred)
What is around $200?
300
The slope of this regression line (rounded to the nearest tenth)
BONUS: Imagine the slope of a line crossing point N and P alone (also rounded to the nearest tenth)
What is -0.3x?
BONUS ANSWER: What is -0.7x?
300
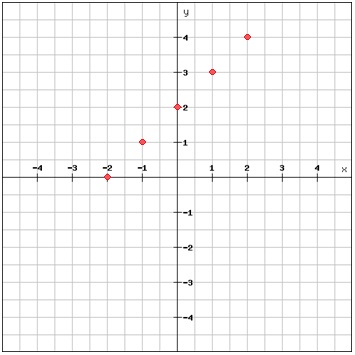
y-intercept equation of these points (imagine an EQL line)
What is y=x+2?
300
The correlation coefficient of this graph rounded to the nearest tenth?
BONUS: This is a strong or weak correlation
What is r=0.7 or 0.7?
BONUS ANSWER: What is a strong correlation?
300
Both the slope of the EQL and y-intercept are negative
What is False?
300
The aproximate coordinates of this blue point
BONUS:
What is the y-intercept of the EQL shown?
What is approximately (102, 103)?
BONUS ANSWER: What is 3?
400
The slope of these two points
What is 8/7x?
400
The approximate (rounded to the nearest tenth) y-intercept equation of the blue regression line
BONUS: The coordinates of the point that show the x-intercept (RED LINE)
What is y=0.5x+6.1?
BONUS ANSWER: What is (-5, 0)?
400
y=-0.25x+1 is the y intercept equation for this graph, imagine this was switched to the inequality y≤-0.25x+1.
Which point (A or B) would NOT be appropriate for this graph?
What is A?
400
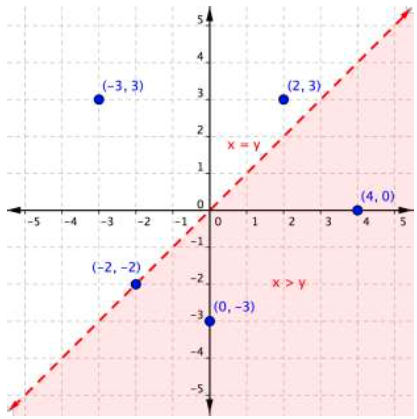
Based on the image, both points (-2, -2) and (-3, 3) are a part of the inequality x<y
BONUS: The y-intercept equation of the EQL
What is False?
BONUS ANSWER: What is y=x?
400
Point shown on this polygon closest to the x-intercept
BONUS: The approximate (rounded to the nearest point) x-intercept of this EQL
What is (6, 1)?
BONUS ANSWER: What is (9, 0) or 9?
500
The slope of this regression line rounded to the nearest tenth
BONUS: Round it to the nearest hundreth
What is -0.1x
BONUS ANSWER: What is -0.09x
500
y-intercept equation of this graph
BONUS: Imagine the left side of this graph shaded, would all three points (1, 5), (-1, 7), and (2, 3) fit in this new inequality?
What is y=2x+3?
BONUS ANSWER: What is no/false?
500
Points (2,3), (3,5.53), and (3,66) are located on a graph. Could this be a function?
What is no/false?
500
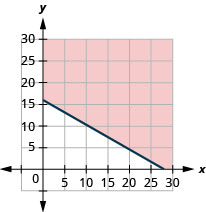
(APPROXIMATELY) The inequality y<-0.5x+15 is appropraite for this shaded representation
What is False?
500
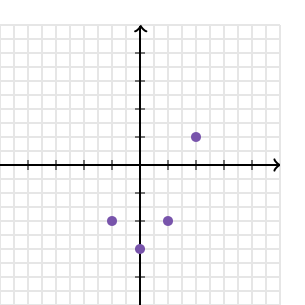
The regresssion line shown is made of points A, B, C, and D. Which point, if erased, would have the greatest impact of change on the line?
BONUS: When erasing said point, where would the new y-intercept be, rounded to the nearest point?
What is D?
BONUS ANSWER: Where is -5 or (0, -5)?