Statistical or Non-Statistical
What is the average snowfall for the month of March in Colorado?
Statistical
Keywords: Average, Typical
An interval of a histogram is called...
Bin
Maximum minus minimum
Range
36, 95, 94, 104, 34, 65, 36, 84, 104, 36
The mode is 36
36, 95, 94, 104, 34, 65, 36, 84, 104, 36
Put these Integers in order from smallest to largest.
1/2 -3/2 -1 1 1/2 -2/3
-3/2 -1 -2/3 1/2 1 1/2
Give the Opposite Number for these Numbers
-3, -1/2, 3/8, 88
3, 1/2, -3/8, -88
How big is each bin on the Tree Heights histogram.
150-100 = 50
Data or value that occurs the MOST often.
Mode
What are the Minimum, Maximum, and Range of the Data Set.
3, 5, 9, 15, 12, 19, 7
3, 5, 7, 9, 12, 15, 19
Minimum : 3
Maximum : 19
Range : Maximum-Minimum : 19 - 3 = 16
5.2, 5 1/2, -5 3/8, 5.75, 5 2/16
-5 3/8, 5 2/16, 5.2, 5 1/2, 5.75
Coordinates for Letter D
(3, -1)
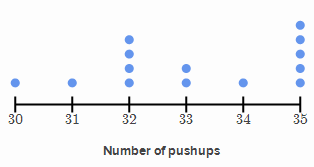
Create a dot plot based on the data about Number of Push-ups.
35, 34, 31, 30, 35, 32, 33, 35, 33, 32, 35, 32, 32, 35

Once a data set is put into order, the middle data value is this landmark of data.
Median
Find the Mean
55, 63, 73, 32, 58, 61
55 + 63 + 73 + 32 + 58 + 61 = 342
342/6 = 57

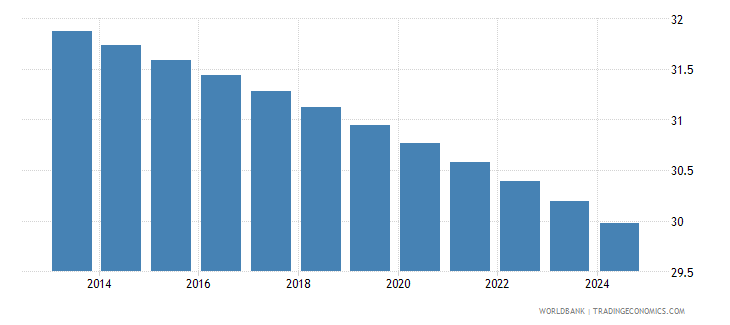
Some people may think the Population of Estonia expand exponentially, What is the actual change?
36-31= change of 5 %

Plot the opposite of the numbers on the Number line
-4, 9, 0, 1, -6

-4, 9, 0, 1, -6
How many Black Cherry Trees were measured?

3+3+8+10+5+2 = 31 Black Cherry Trees
This landmark of data is found by adding all data values and dividing by number of data points.
Mean
Find the Median of the Data Set
55, 52, 84, 32, 76
Put Numbers in Numerical Order
32, 52, 55, 76, 84
Find the Middle Value
32, 52, 55, 76, 84

9/9 , 13/6, 8/3, 14/4
What would you label the Title and Axes of this table.

Title: How many Children in my Neighborhood
X axis - Number of Children
Y axis - Number of Families
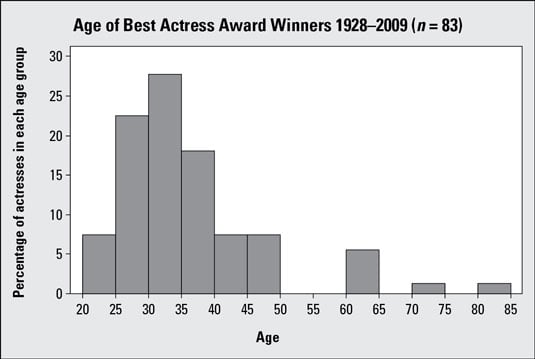
What is the mean average for Age of Best Actress Award Winners

Mean, Median, and Mode are all single data values describing the averages of a data set are also known as?
Measure of Center
Find the Median
58, 43, 33, 57, 63, 69
Put the Data in Order
33, 43, 57, 58, 63, 69
Find the Average between the two data values
57 +58 =155/2 = 57.5
How do you spell Ms. Nehrbauer's last name?
N e h r b a u e r
