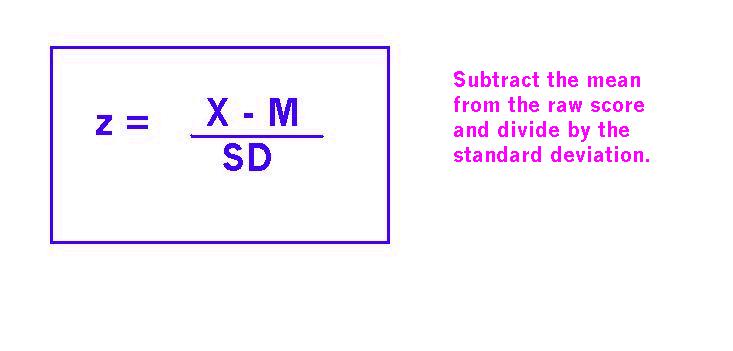
What is the correct formula for converting a Raw Score to a Z Score?

If your mean is greater than the median then this would be a negative skew.
True or False?
False, if the mean is greater than the median then this would be a positive skew.
Round the following to the nearest thousandths place (three places to the right of the decimal place):
79.96
79.96 or 79.960
What type of graph is shown below?

Histogram
Identify if the variable mentioned below is continuous or discrete as well as the measurement scale that should be used:
Waist Size (S, M, L)
Discrete & Ordinal
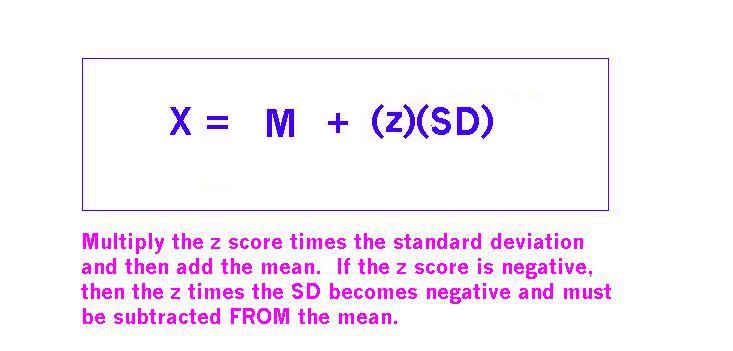
What is the correct formula for converting a Z Score to a Raw Score?
Bonus: What do you do if the Z Score is negative?

If your mean is less than the median then this would be a negative skew.
True or False?
True
Round the following to the nearest thousandths place (three places to the right of the decimal place):
79.9995001
80.000 or 80
Based on the following graph, is this a normal distribution?
Bonus: If not, what type of distribution is it?

No
Bonus: Positive Skew
Identify if the variable mentioned below is continuous or discrete as well as the measurement scale that should be used:
Letter Grade (A, B, C, D, or F)
Discrete & Ordinal
Convert x = 89 to a Z Score
Mean = 98
Standard Deviation = 10
N = 135
-0.90 or -0.9 or -.9
Based on the following data set, what is the Range?
97, 97, 96, 95, 97, 97, 98, 96, 95, 96, 96
3
Round the following to the nearest thousandths place (three places to the right of the decimal place):
79.9995000
80.000 or 80
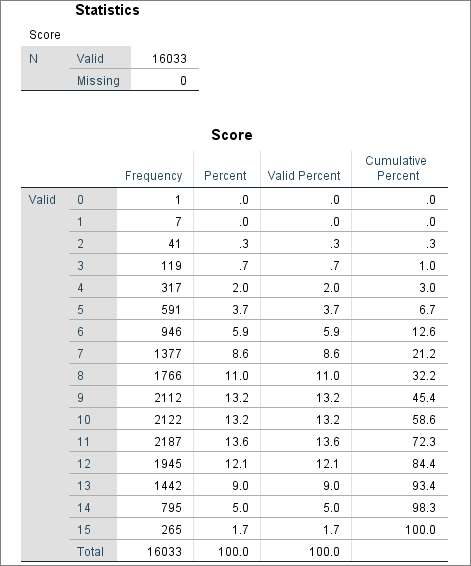
Based on the following SPSS Output, how many participants participated in the following experiment?

N = 16,033
Identify if the variable mentioned below is continuous or discrete as well as the measurement scale that should be used:
Score Grade
Continuous & Ratio
Convert the following Z Score into a Raw Score: -1.2
Mean = 98
Standard Deviation = 10
N = 135
86
Based on the following data set, what is the Variance?
97, 97, 96, 95, 97, 97, 98, 96, 95, 96, 96
0.777
Based on the following data set, what is the Σx?
97, 97, 96, 95, 97, 97, 98, 96, 95, 96, 96
1,060
Based on the following SPSS Output, which score has the highest frequency?
Bonus: How do you come to the correct answer?

11
Bonus:
If you look at the Frequency Column next to the scores, there you will see the number of times a score appears (aka the frequency of the score). You look for the highest number, in this case "11" and see that the frequency is "2,187."
OR
If you look at the Percent Column next to the Frequency Column, there you will see the percentage of frequencies. You look for the highest number, in this case, "13.6%" and see that the frequency is "2,187" and the score for that is "11."
Identify if the variable mentioned below is continuous or discrete as well as the measurement scale that should be used:
Change in Speed
Continuous & Interval
What is the percentile of body temperature 94?
Mean = 98
Standard Deviation = 10
N = 135
Bonus: Explain how you come to your answer.
0.3446 or 34.46% or 34%
Bonus: After solving for the Z Score for "94" you find that number (-0.40) in the A Column and since the body temperature of "94" falls below the mean line of "98" we will focus on the C Column and in that column, the answer is "0.3446."
Based on the following data set, what is the Standard Deviation?
97, 97, 96, 95, 97, 97, 98, 96, 95, 96, 96
0.881
Based on the following data set, what is the Σx^2?
97, 97, 96, 95, 97, 97, 98, 96, 95, 96, 96
102,154
Based on the following SPSS Output, what is the relative frequency proportion of score 4?
Bonus: How do you come to the correct answer?

0.020 (After Rounding)
Bonus: You look at the Frequency Column next to the score "4", there you will see "317." You take that score and divide it by Ntot and you should get "0.0197717..." and then round to the correct answer, "0.020."
Identify if the variable mentioned below is continuous or discrete as well as the measurement scale that should be used:
Arm Size (in Inches)
Continuous & Ratio