Ch. 3 (Collecting, Organizing & Displaying Data)
Ch. 4 (Patterns and Relationships)
Ch. 5 (Measurement of Circles)
Ch. 4 Vocab & Definitions
Ch. 5 Vocab & Definitions
100
Jordan is doing a heat lab. He is measuring the change in temperature of a glass of water as the water is heated up. What type of graph would be most suited for displaying this data and why?
A line graph would be most suitable for displaying this data because Jordan wants to display the change in the water's temperature over time.
100
Evaluate 5y + 3 when y = 6.
5y + 3
= 5(6) + 3
= 30 + 3
= 33
100
What is the circumference of a circle with diameter 30.7 cm?
C = 𝛑d
= 𝛑(30.7 cm)
≐ 96.45 cm
Therefore, the circumference of the circle is about 96.45 cm.
100
What do you call a letter or symbol that represents a number?
A variable
100
What is the term used to describe a line segment that goes from the center of a circle to its circumference?
Radius
200
A scatter plot displays an increasing linear relationship between the term numbers and term values of a particular pattern. What type of correlation is displayed between the term numbers and the term values in this graph?
A perfect positive correlation
200
Find the general term of the number sequence: 3, 5, 7, 9,...
2n + 1
200
What is the area of a circle with diameter 14 cm?
r = d ÷ 2
= 14 cm ÷ 2
= 7 cm
A = 𝛑r2
= 𝛑(7 cm)2
≐ 153.94 cm2
Therefore, the area of the circle is about 153.94 cm2.
200
What is the name of the type of chart used to record the term numbers and the term values of a number sequence or pattern.
A table of values
200
What do you call the boundary of a circle?
Circumference
300
Kris says that there are two outliers in the following data set, while Kacey says there are none. Is either boy correct? Explain your reasoning.
1 , 36 , 37 , 40 , 43 , 52 , 57 , 1000
Kris is correct; there are two outliers in the data set: 1 and 1000. These are outliers because they are significantly different from the other numbers in the set; 1 is much smaller and 1000 is much larger than the other numbers in the set.
300
Find the general term of the number sequence: 40, 37, 34, 31, ... Then, use it to find the 11th term of the sequence.
General term = -3n + 43
n = 11
-3n + 43
= -3(11) + 43
= -33 + 43
= 10
The 11th term of the sequence is 10.
300
A sprinkler sprays water in a circular path. If the circumference of the path is 5 m, how far does the water spray from the sprinkler?
r = C ÷ 2𝛑
= 5 ÷ 2𝛑
≐ 0.80 m
Therefore, the water sprays a distance of about 0.80 m from the sprinkler.
300
What do you call a combination of one or more variables that may include numbers and operation signs (e.g. 8n + 3)?
An algebraic expression
300
What do you call a line segment that joins any two points on the circumference of a circle (this also includes the diameter of a circle)?
A chord
400
The range of Bianca's Math test scores is 24. She wishes to display her test scores in a histogram. Calculate the number of intervals she would have if she uses an interval size of 5.
Is five a suitable interval size? Explain why/why not.
# of intervals = range ÷ interval size
= 24 ÷ 5
= 4.8 (round to 5)
Therefore, Bianca would have five intervals if she uses an interval size of 5.
Five is a suitable interval size because it gives five intervals, which falls within the allowable number of intervals for a histogram (i.e. minimun # of intervals = 3; maximum # of intervals = 8).
400
Use the general term of the number sequence: 40, 37, 34, 31, ... to determine the term number of term value -2.
General term = -3n + 43
-3n + 43 = -2
-3n = -2 - 43
-3n = -45
n = -45 ÷ (-3)
n = 15
Therefore, -2 is the 15th term in the sequence.
400
The $2 Canadian coin (i.e. the toonie) has a copper center surrounded by a ring of nickel. The diameter of the coin is 2.8 cm. The area of the copper center is 2.0 cm2. What is the area of the nickel ring?
Radius of the Coin:
r = d ÷ 2
= 2.8 cm ÷ 2
= 1.4 cm
Area of Entire Coin:
A = 𝛑r2
= 𝛑 (1.4 cm)2
≐ 6.1575 cm2
Area of Nickel Ring:
A = 6.1575 cm2 - 2.0 cm2
≐ 4.16 cm2
Therefore, the area of the nickel ring is about 4.16 cm2.
400
What do you call each number or item in a sequence?
A term
400
What is the term given to a section of the circumference of a circle that lies between two ends of a chord?
Arc
500
Which of the graphs shown below is misleading: Graph 1, Graph 2 or both? State the characteristic(s) that make the graph(s) you've selected misleading and the impact the characteristic(s) has on the interpretation of the data.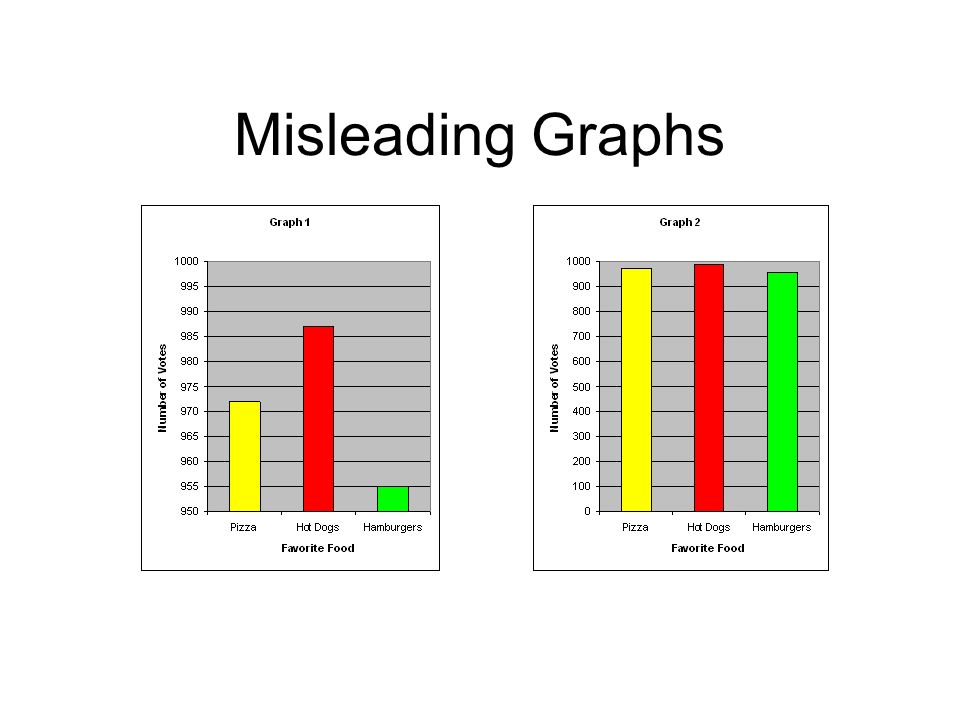
Graph 1 misleading; Graph 2 is the corrected graph. Graph 1 is misleading because the y-axis scale does not start at 0. As a result, the graph gives the impression that there is a great difference in the number of votes for pizza, hot dogs and hamburgers when in reality the votes for all three categories were very close (as shown in Graph 2).
500
Janelle created a pattern using toothpicks. The first figure of her pattern has 4 toothpicks, the second figure has 10 toothpicks, the third figure has 18 toothpicks and the fourth figure has 28 toothpicks. If Janelle continues her pattern, how many toothpicks would she need for the 12th figure? Find and use the general term of the sequence (write it in factored and simplefied forms) to solve this problem. HINT: This is a Lesson 4.4 Problem (refer to your lesson note for help, if needed!).
General term (factored form) = n(n + 3)
General term (simplified form) = n2 + 3n
n = 12
n(n + 3)
= 12(12 + 3)
= 12(15)
= 180
Therefore, Janelle would need 180 toothpicks for the 12th figure of her pattern.
500
The area of a circular bicycle wheel is about 3,088.32 cm2. How far does the bicycle travel after one rotation of the wheel? Round your answer to the nearest whole.
Radius of the Wheel:
r = sqrt(A ÷ 𝛑)
= sqrt(3 088.32 cm2 ÷ 𝛑)
≐ 31.3535 cm
C = 2𝛑r
= 2𝛑(31.3535 cm)
≐ 197 cm
Therefore, the bicycle travels about 197 cm after one rotation of the wheel.
500
BONUS: What do you call an orderly arrangement of facts set out for easy reference; for example, an arrangement of numerical values in vertical and horizontal columns?
A table of values
500
BONUS: What do you call the ratio of the circumference to the diameter of a circle?
Pi (𝛑)