Your Command Is My Swish
Function Junction
Best of All Possible Worlds
Atop the Charts
Appreciating Value
100
Same as above, same as above! Highlight your cells and then enter this command.
What is Ctrl-D?
100
I need to build a *dynamic* query to pull a specific financial statement item for a specified year, so I used these functions to reference dropdown menus and pull the correct result.
What are "Index" and "Match"?
100
This tool is helpful when you know the correct answer and need to find the input that makes everything tie out.
(e.g., the discount rate for residual profits when you know the discount rates for routine profits and for total profits)
What is Goal Seek?
100
To show the linear regression of data over a time horizon on a column, scatter, or line chart, right click the chart and select this option.
What is "Add Trendline"?
100
You should reduce future income streams under the relief from royalty method by this factor in order to account for useful life of the IP.
What is the decay rate?
200
Oops, the client data is working on a cash flow-basis instead of operating income.
I need to cut the depreciation expense row and put it above Operating Income and insert it above EBIT using this function.
What is Ctrl-Shift-+
200
The NPV and IRR functions are limited to cash flow streams that are made exactly one year apart. These similar Excel functions allow you to reference dates in addition to cash streams to calculate a rate of return or present value.
What are "XNPV" and "XIRR"?
200
When a Pivot Table lacks the exact column of data you need to present, the best practice would be to create the dataset by pressing this button under the Pivot Table ribbon
What is "Insert Calculated Field"?
200
I need to present both income and tax rate on the same chart, so I choose this type of graph and add a secondary Y-axis
What is a Combo Chart (or Combination Column/Line Chart)?
200
Income-based approaches most typically used for transfer pricing valuations. However, these two general alternative approaches exist though their acceptance by tax authorities is mixed.
What are cost-based (ROI or Replacement cost) and market-based (APM, Market cap method) approaches?
300
I like the format of the cell, so I use this shortcut to format others just like it (after Ctrl-c)
What is Alt-H-V-S-T?
300
I use this symbol in my function when I need to join two strings of text.
What is an ampersand?
(Also CONCATENATE formula if you want to combine text that already exists in cells)
300
This powerful tool is set up by referencing an output cell and building rows and columns of 2 or more input variables for which a range of possible values is more realistic than using a single input
What is a data table?
300
The bars is my chart are too close together, so I need to modify this under series options.
What is Gap Width?
300
It is equal to a financial flow * (1+g)/(discount rate - g). Don't forget to discount that back to present value too!
What is the terminal value?
400
That's not a currency! I need to use these two commands to make the operating margin a percentage with one decimal point.
What are Alt-H-P and Alt H-0?
400
I need to know the number of positive values in a column of observations and due to foolish people who are inappropriately merging cells, I can't sort my data from largest to smallest. Instead, I use this function to see how many observations are positive.
What is CountIf(Range,>0)?
400
When modelling multiple scenarios, this tool creates a list of scenario options that the model user can select, thus preventing an invalid entry.
What is Data Validation?
400
Micosoft recently made it easier to directly add in this special type of chart, which shows the causes of the delta between a beginning and an end number (e.g., 2020 and 2021 Operating Income)
What is a waterfall chart?
400
Calculating a tax benefit from IP sale is not just about the rate differential. Don't forget to include this additional benefit to the buyer!
What is tax amortization?
(Applicable for FMV valuation)
500
In PowerPoint, grouping objects is as easy as Ctrl-G and Ctrl-Shift-G.
However, in excel, you may need to group and hide the margin row by highlighting the rows/colums and using this less logical command.
Alt-Shift-Right Arrow
500
The beginning of the cell contains an important entity number that we want to reference, but it contains irrelevant contents in the same cell. To cleanse the data and only see the first four digits of the cell, we can either use Text to Columns or this built in function.
What is LEFT?
500
This special type of filter can automatically modify a P&L by showing results for only a subset of data.
What is a Slicer?
500
This new Excel chart presented below is useful in present qualitative subdivisions of a hierarchy and makes use of the color variable to drive home key messages.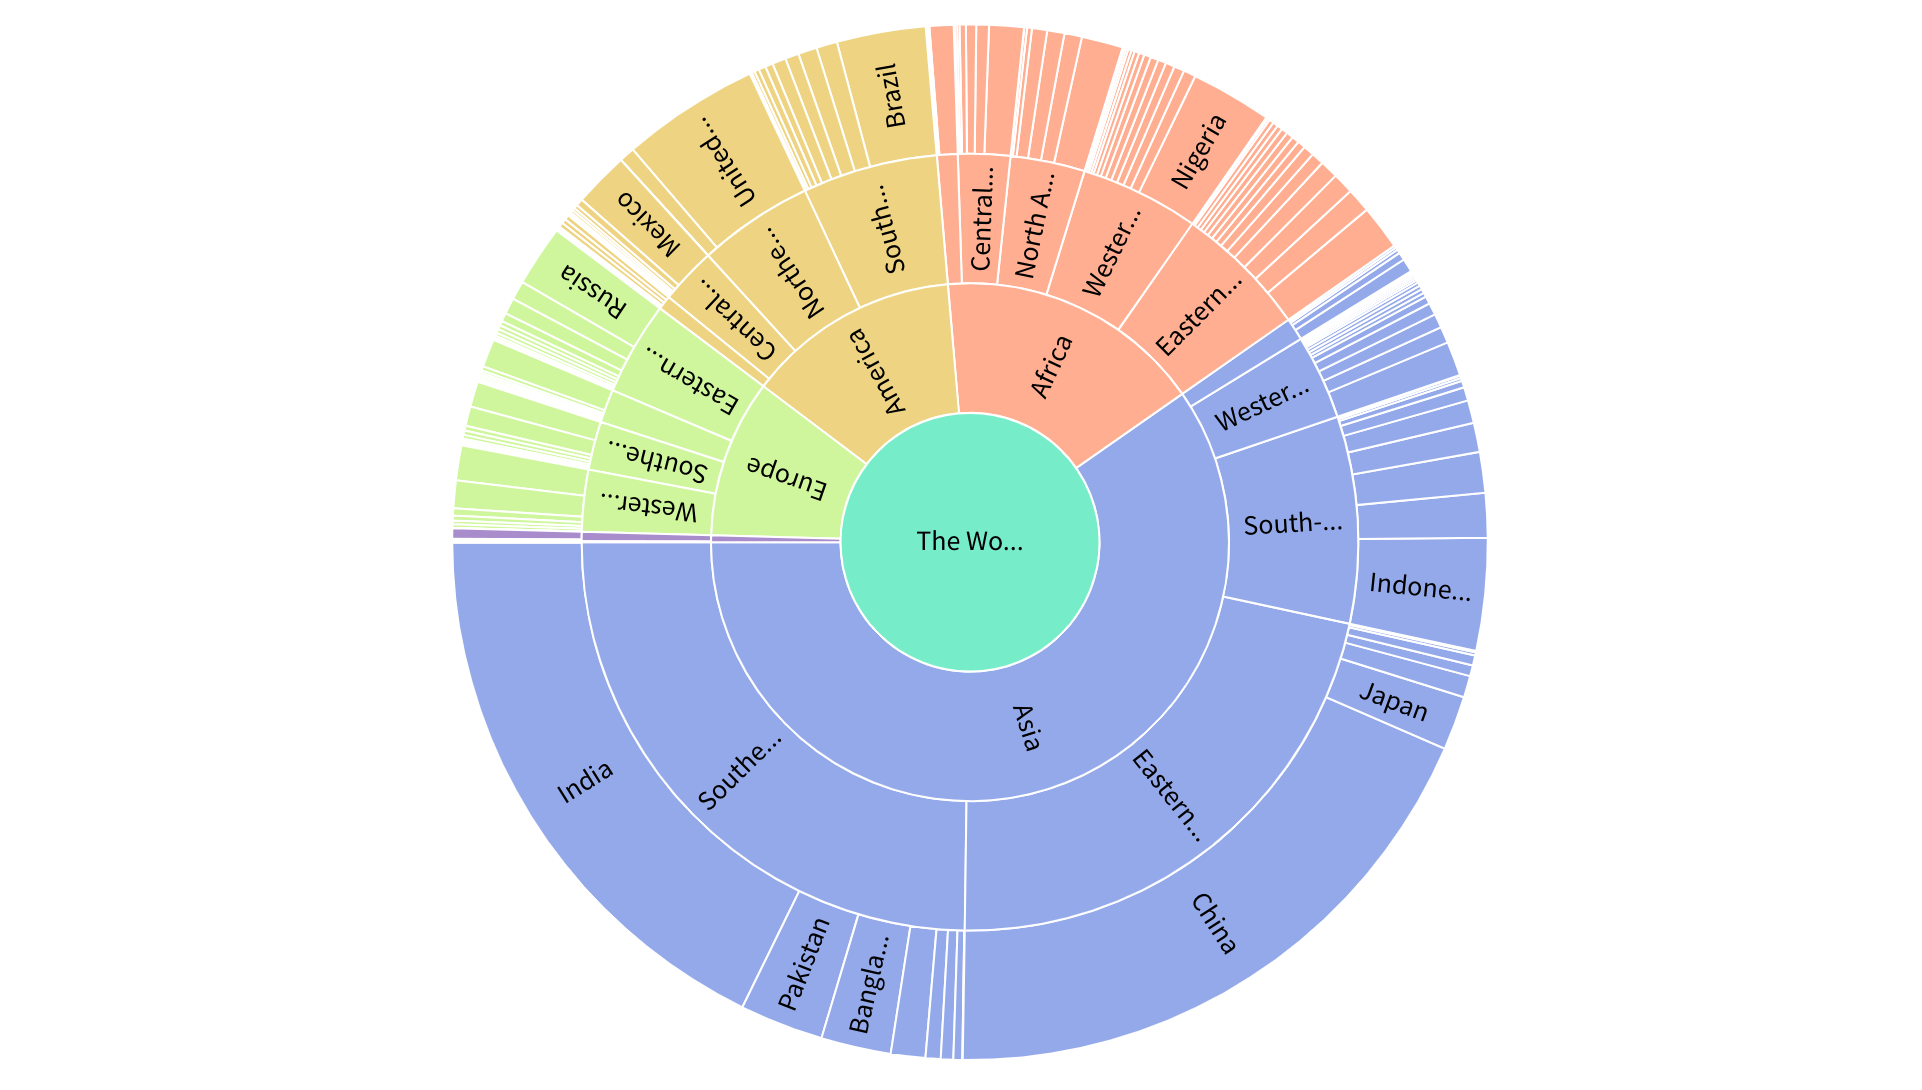
What is a sunburst chart?
500
As presented by Mike McDonald, this rare condition during an IP transaction occurs when the maximum price that an arm's length buyer is willing to pay is still lower than the minimum price that an arm's length seller would be willing to sell for (often as a result of a taxable sale and non-deductible purchase).
What is indeterminacy?