Ecology Basics
Populations
Biodiversity
Biomes & Climate
Hazards & Human Impact
100
This science studies how organisms interact with each other and their environment.
Ecology
100
This term means the number of individuals of a single species in a given area.
Population size
100
This term refers to the variety of life at all levels.
Biodiversity
100
This term describes long-term average temperature and precipitation.
Climate
100
This principle means the effect of a toxin depends on the amount of exposure.
The dose makes the poison
200
This level of organization includes all living and nonliving components of an area.
Ecosystem
200
The number of individuals per unit area is called this.
Population density
200
This level of biodiversity refers to differences in DNA within a species.
Genetic diversity
200
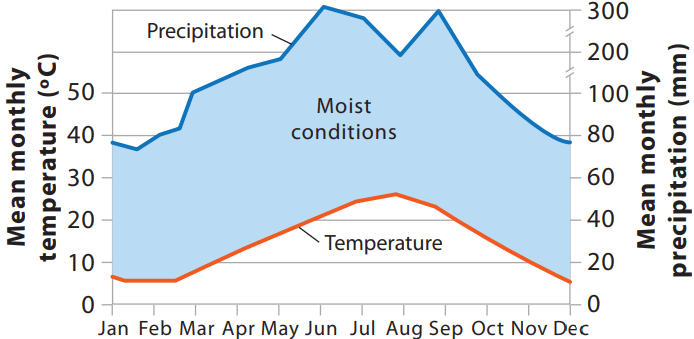 This type of graph shows temperature and precipitation for a location.
Climatograph
200
This radioactive indoor air pollutant comes from rock and soil.
Radon
300
Grass, fungi, and bacteria are "living" examples of these ecosystem components.
Biotic factors
300
This type of population distribution is most common in nature.
Clumped
300
This process increases biodiversity by creating new species.
Speciation
300
This biome has the highest biodiversity and net primary productivity.
Tropical rain forest
300
Tornadoes, hurricanes, and earthquakes are examples of this hazard type.
Physical hazards
400
This term describes the specific place where an organism lives.
Habitat
400
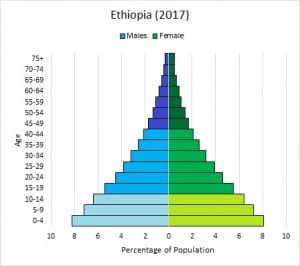 This type of diagram shows the age distribution of a population.
Age structure diagram
400
This process decreases biodiversity by removing species.
Extinction
400
Grasslands with scattered trees best describe this biome.
Savanna
400
This field studies how diseases spread through populations.
Epidemiology
500
This level of organization includes all life on any given planet and the environments that support it.
Biosphere
500
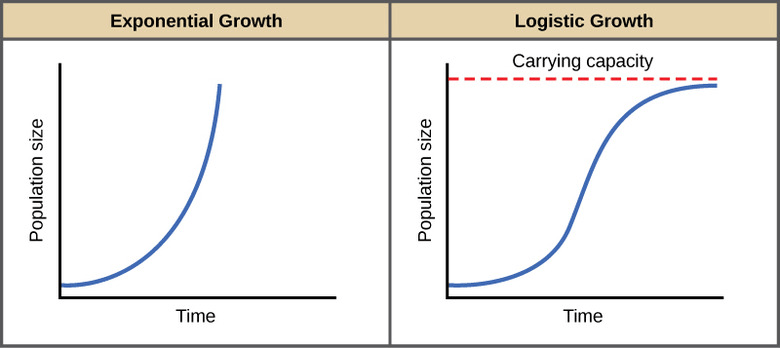 This term describes the maximum population an environment can support.
Carrying capacity
500
This global pattern shows biodiversity increases toward this region.
Equator
500
This biome is characterized by permafrost.
Tundra
500
Affluent societies tend to increase this measure of environmental impact.
Ecological footprint