Number Sense and Operations
Algebraic Reasoning
Geometric Reasoning
Data Analysis and Probability
Miscellaneous
100
Determine the Least Common Multiple (LCM) of 12 and 15
60
100
Find the quotient
3/8 -:7/3
9/56
100
Which Coordinate grid correctly plots the point (-2,2)
A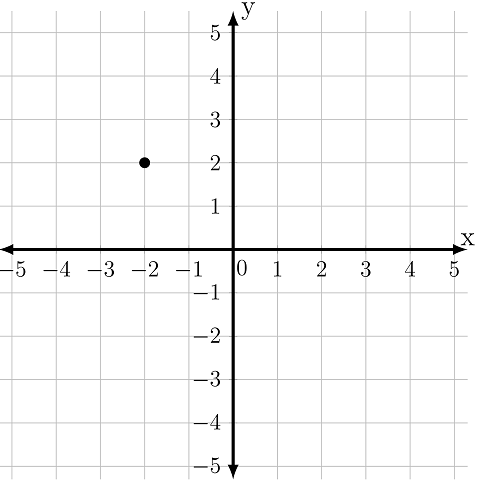
B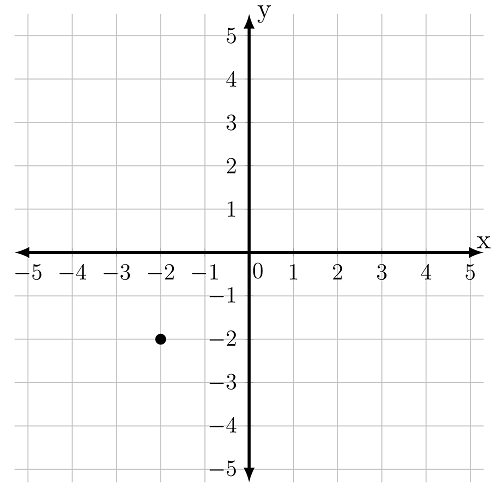
C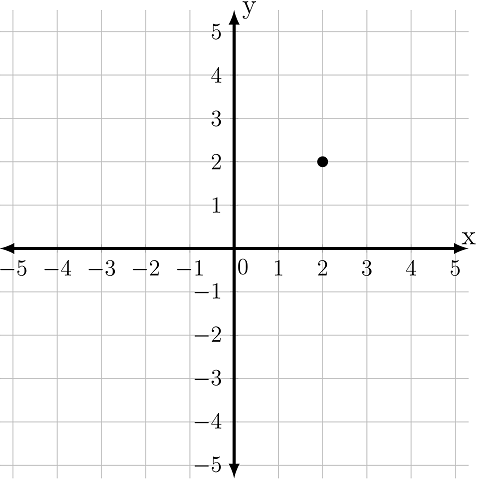
D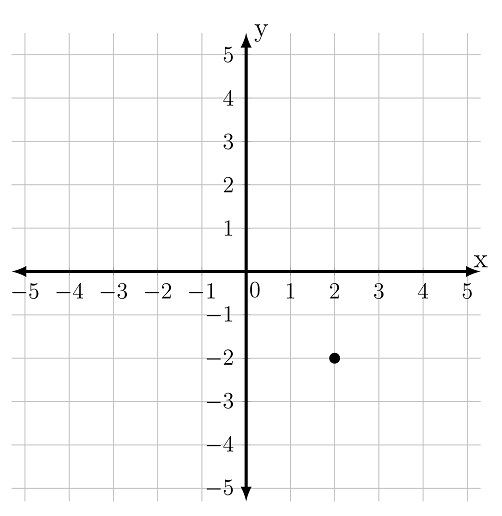
100
Which of the following data sets are numerical? Select all that apply.
A. Time it takes to get to school
B. Flavors of Jelly Bellys
C. Eye color of students in your class
D. Instagram followers
E. Average hours slept per night
A. Time it takes to get to school
D. Instagram Followers
E. Average hours slept per night
100
An equation is shown.
x+31.3=38.9
What is the value of x?
x=7.6
200
What is the product of
7.12*9.8
69.776
200
What is the quotient of
4 2/5 -: 3/5
7 1/3
22/3
200
The net of a three-dimensional shape is shown.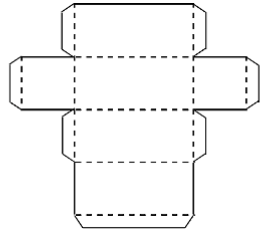
What is the three-dimension shape formed by this net?
A. Retangular Pyramid
B. Rectangular Prism
C. Cylinder
D.Sphere
B. Rectangular Prism
200
Which of the following data sets are categorical? Select all that apply.
A. Height of a 6th grader
B. Names of all math teachers at school
C. Monthly salary
D. Favorite summer Olympic sport
E. College major
B. Names of all math teachers at school
D. Favorite summer Olympic sport
E. College major
200
24/f +n
Evaluate the expression with f=-4 and n=3
-3
300
Determine the Greatest Common Factor( GCF)of 39 and 87
3
300
Convert 0.137 into a percent
13.7%
300
The dimensions of a right rectangular prism are shown.
Length: 5in.
Width :8in.
Height :14.5in.
What is the volume?
580 cubic inches
300
A line plot is shown representing the car sales at a local car dealership.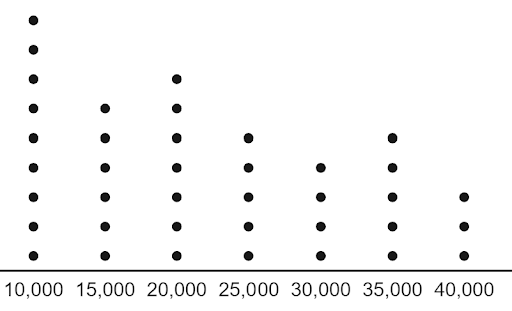
How many cars were sold for $25,000?
5
300
Evaluate
-6-15
-21
400
Which expression is equivalent to 136+40 using the GCF as a common factor?
A. 2(68+40)
B. 4(10+34)
C. 5(8+136)
D.8(5+17)
B. 4(10+34)
D. 8(5+17)
400
What is 0.002 as a percentage?
0.2%
400
Find the area of the triangle
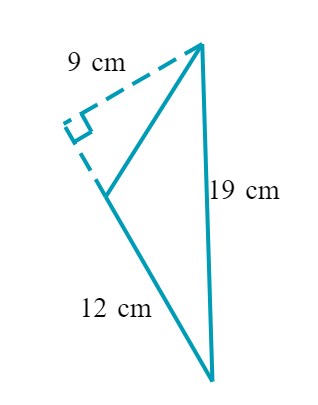
54 square centimeters
400
A teacher recorded the time students spent on a quiz (in minutes).The results are shown in the line plot.
Where are the gaps located in the line plot?
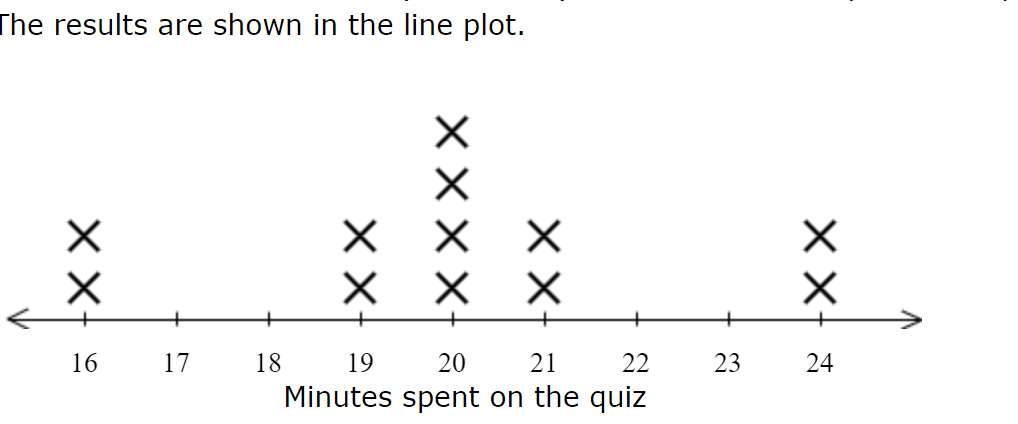
17, 18, 22 and 23 minutes
400
(-8)*416*(-2)
6656