Back to basics
Linear regression
Probability
Normal distributions
Reject the HO!
100
What is an example of a categorical variable?
Ex: Anything qualitative such as gender, race, grade, zip code, etc.
100
What is deliberate bias?
When a question is worded to support a certain cause or illicit a particular response
100
A probability teacher is rolling a die. Y is the number that comes up. Is the random variable Y discrete or continuous?
Discrete
100
The null hypothesis is symbolized using...
Ho
100
The P-value for a hypothesis test is P = 0.066. Do you reject or fail to reject Ho when the level of significance is α = 0.05?
Fail to Reject Ho, since the P value is greater than the level of significance
200
What is an example of a discrete quantitative variable?
Ex: number of children, number of pets, items of clothes (NO decimals, only whole number possibilities)
200
Which r-value represents a weaker correlation? r= -0.9 or r=0.2
r=0.2
200
What is it called when two events cannot occur simultaneously?
Mutually exclusive
200
True or False: When the distribution is not normal (such as skewed), the shape of the sampling distribution will still become approximately normal if the sample size is “large”.
True
200
True or false: In a two-tailed hypothesis test, the alternative hypothesis states that the parameter is greater than or less than a specific value.
False!
300
What are the measures of position? (hint:5 # summary)
1.Minimum
2.1st Quartile (Q1)
3.Median (aka 2nd Quartile)
4.3rd Quartile (Q3)
5.Maximum
300
What is the main difference between observational and experimental studies?
Observational: Not applying a treatment, can't establish causation
Experimental: applying a treatment/placebo, can establish causal relationships
300
Is the following a probability distribution? The random variable x represents the number of tickets a police officer writes out each shift.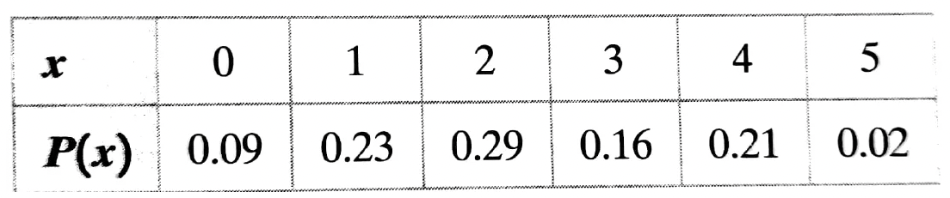
Yes, the probabilities total 1 & are between 0 and 1.
300
As confidence level increases the width of interval ____.
Increases
300
We want to test whether the mean height of eighth graders is 66 inches, as we suspect it's actually lower. State the null and alternative hypotheses.
Ho: μ = 66; Ha: μ< 66
400
What method of sampling?: A news station posts a poll on Instagram asking for the public's opinion on a new parking lot being built in town and people can choose to respond.
Voluntary/Self-select
400
Given the following linear regression line, ŷ = -12 + 3.2x, what is the predicted value of y if x=2.4
-4.32
400
What percent of students with cell phones also have a driver's license?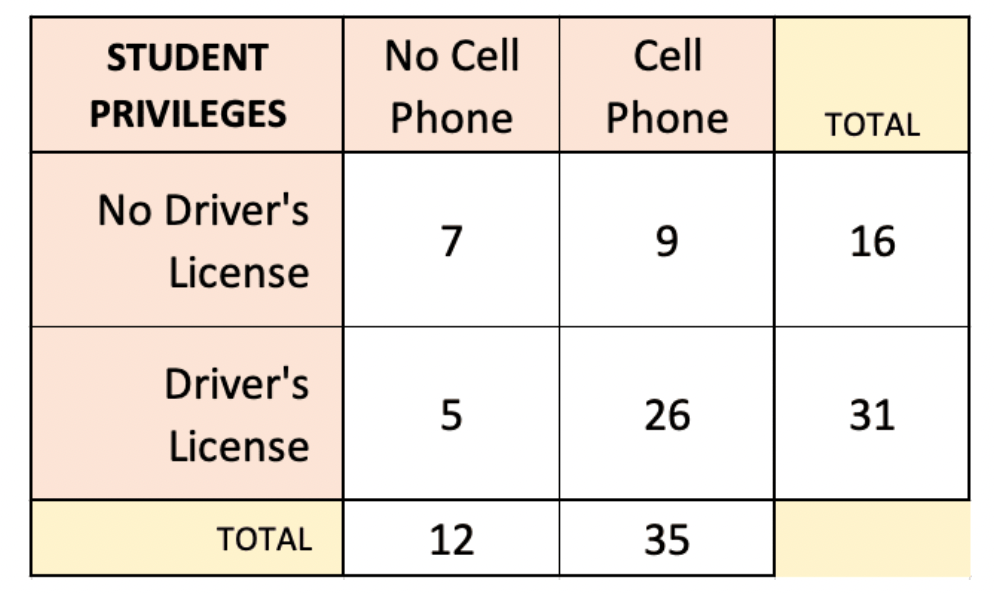
74.3%
400
Calculate Claire's Z-score: It takes Claire 17 minutes to walk to class. Among all students, the average time it takes to get to class is 15 minutes with a standard deviation of 2 minutes.
Z-score= 1
400
Describe a Type 1 and 2 error for this scenario:
Ho: Devyn does not have the flu
Ha: Devyn does have the flu
Type 1 (False positive): When Devyn does not have the flu but you say she does.
Type 2 (False negative): When Devyn actually has the flu but you say she does not.
500
Use the IQR method for identifying outliers to determine any in this data set: 0, 2, 5, 8, 9, 9, 10, 11, 12, 12, 14, 15, 20, 25
25 is the only outlier
500
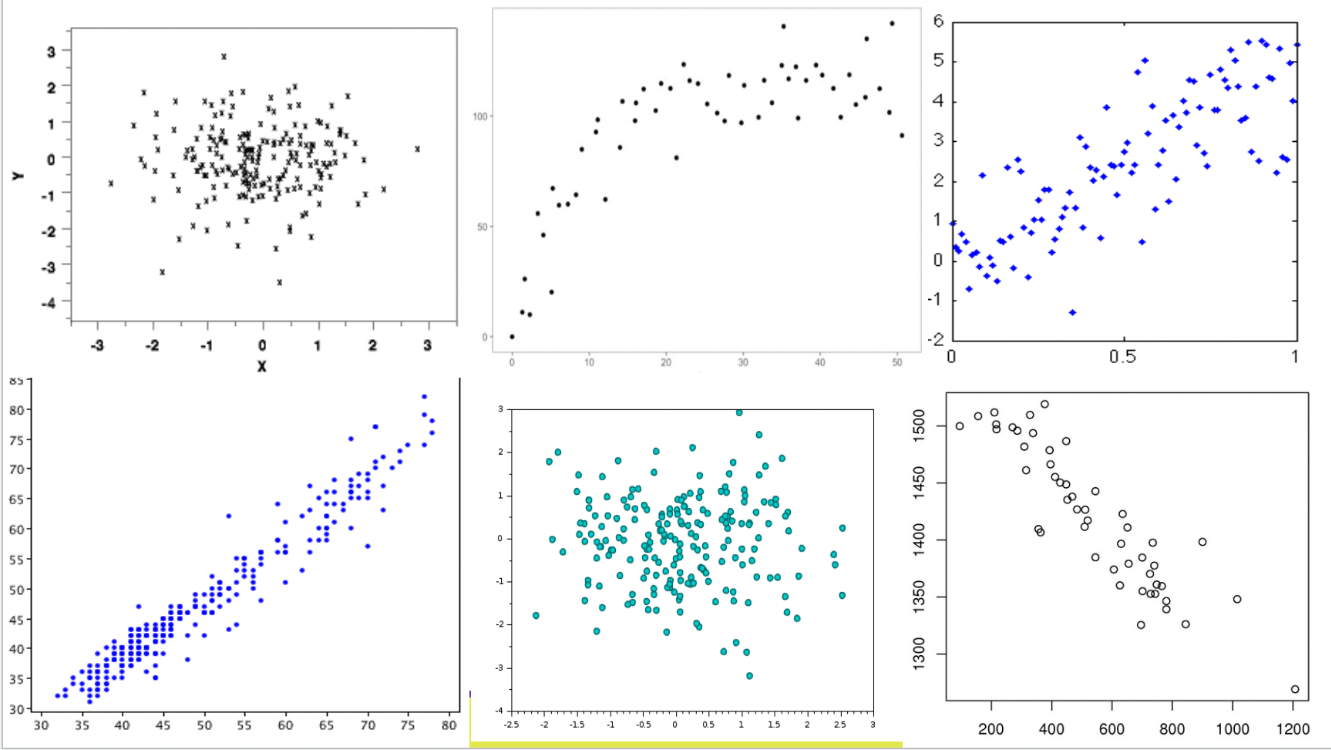
1. No relationship
2. Nonlinear relationship
3. Positive linear relationship
4. Positive linear relationship
5. No relationship
6. Negative linear relationship.
500
Define sample space, outcome, and event.
Sample Space: ALL possible outcomes of a probability experiment
Outcome: result of a single trial of a probability experiment.
Event (E): a specific set of outcomes of a probability experiment.
500
According to the Empirical rule, what percent of data is in the blue-shaded area?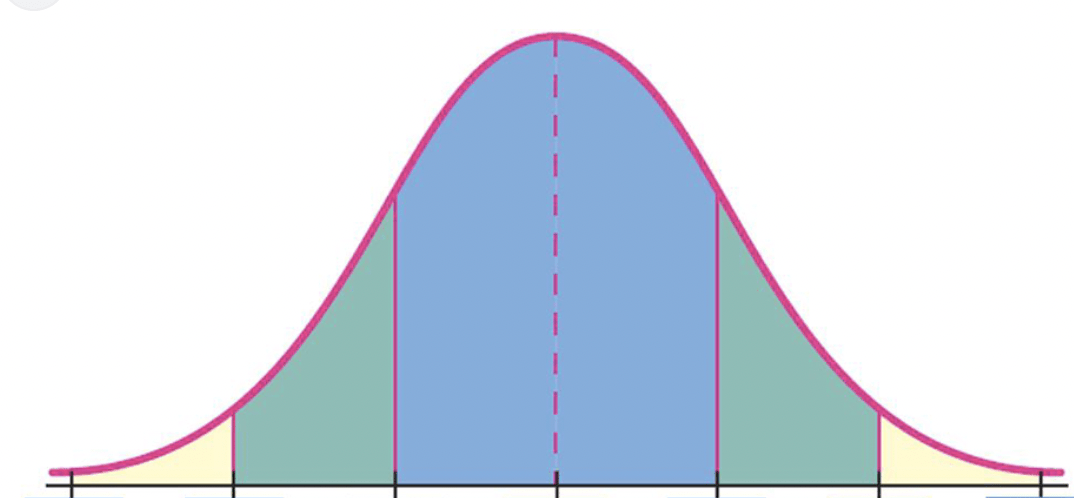
68%
500
A new educational app is designed to improve students' math skills. A teacher decides to evaluate its effectiveness by conducting a study with her class of 25 students.
- Phase 1: Students take a math test before using the app to establish a baseline score.
- Phase 2: Students use the app for 4 weeks and then take the same math test again.
The teacher wants to know if there is a significant improvement in the student's math scores after using the app.
Two-sample paired test, one-sided