Title
Gravity, push, pull are examples of _____________
Forces
The distance from MDS to Minneapolis would be measured in ________ (what unit?)
Km kilometers
Miles
This tool (equipment) is used to measure time.
timer
stop watch
The bottom left corner of the graph must always start with this number.

0 zero
A graph needs a title for this reason.
People can understand what the graph is showing
smallest unit on the meter stick or ruler
mm millimeter
You used this tool (equipment) to measure distance in our experiments.
measuring tape
On a graph, you must __________________ each side to name the numbers or words.
label
a visual way to show information
graph
We used these two units/numbers to measure the air trolley.
cm centimeter
number of winds
You need these two measurements to calculate speed.
distance & time
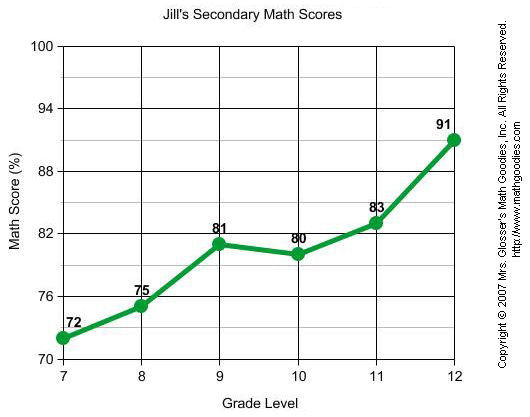
Name the two types of graphs in this picture: 
Bar graph
Line graph
Move from one place to a different place
motion
List 6 different units for time.
second
minute
hour
day
week
year
decade
In science, # means this.
number
This type of variable does not change because of the other numbers.
Independent Variable
The air trolley's distance would change if the number of winds changed. This is an example of this type of variable.
dependent variable
Other people can understand what you measured when you include these.
Units
