Identifying Functions
Linear Functions
Comparing Functions
Writing Equations from Tables & Graphs
Analyzing Functions & Graphs
100
Does the graph represent a function? Why or why not?
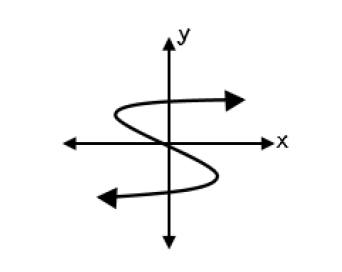
Not a function; does not pass vertical line test.
100
Is this graph linear or non-linear?
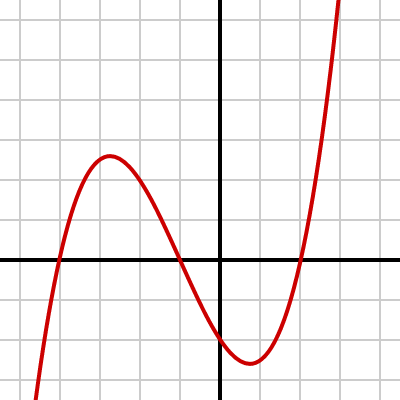
non-linear
100
Which function has the greater rate of change?
Function 1: y=3/4x-7
Function 2: y=3x+4
Function 2
100
What is the slope and y-intercept of the graph?
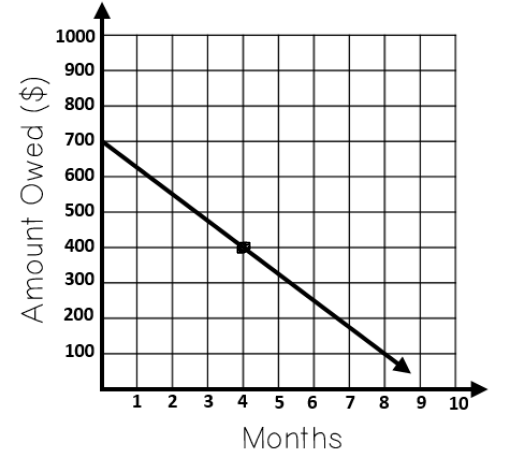
Slope: 75
Y-intercept: 700
100
Describe what is happening in this graph:
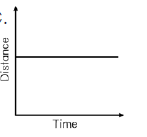
An object is stopped or not moving.
300
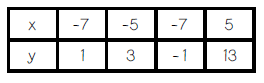
Does this set of ordered pairs represent a function? Why or why not?
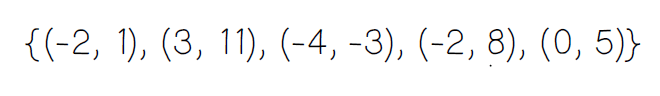
No, the input of -2 has more than one output.
300
Is this equation linear or non-linear? Why?
y=2/3x
Linear, because it is wrote in slope-intercept form.
300
Which function has the smallest rate of change?
Function 1: y=1/2x+9
Function 2:
Function 1
300
Write an equation for the table given.
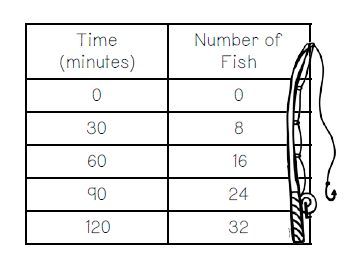
y=4/15x
300
Interpret what is happening in Section E of the graph. Is it linear or non-linear?
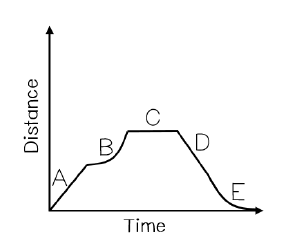
An object moving closer at a decreasing speed.
It is non-linear.
500
Which of the following represents a function?
y=x^2+22
OR
y=x^2+22
500
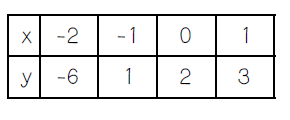
Does the table show a linear or non-linear relationship? Explain why or why not.
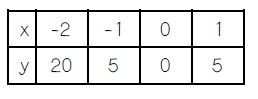
Non-linear because it does not have a constant rate of change.
500
The gas mileage of Brady's car can be represented by the equation y=11x where x is the number of gallons of gas and y is the number of miles traveled. Wyatt's gas mileage is shown in the graph.
Who's vehicle get's better gas mileage?
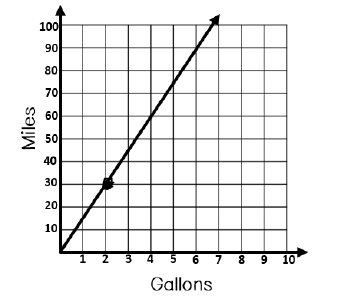
Wyatt gets the better gas mileage at 15 miles per gallon.
500
Identify the slope and y-intercept. Then write an equation for the graph.
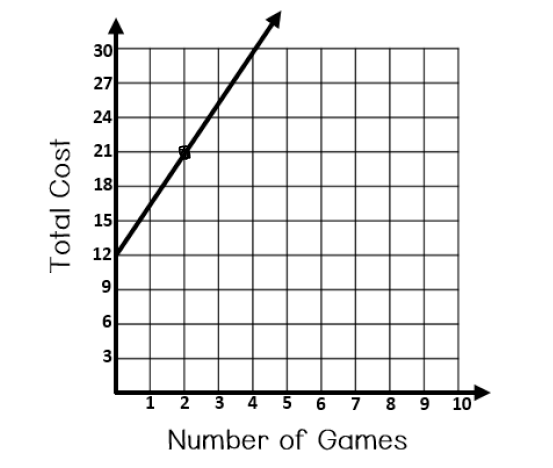
Slope: 4.5
Y-intercept: 12
Equation: y = 4.5x + 12
500
Interpret what you think happened at each section of the graph if Ray is leaving home to go to school.
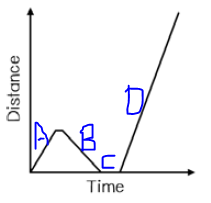
A - Ray walks to school at a constant speed.
B - Ray has to go back home because he forgot his math homework.
C - Ray spends 3 minutes looking for his homework in his room.
D - Ray runs to school at a constant speed.