Doodling
Function or NAH?
evaluATE
L or NL
Equation Poetry
100
A basketball team scores 1 point every minute in the first quarter of the game, doesn't score anything in the second quarter. Then after halftime they score 3 points every minute. Sketch a graph to represent this scenario.
Graph should include an increase, then a constant then an increase.
100
Does the following table represent a function?
x y
1 2
2 5
6 2
4 9
5 1
Yes! Each input has one and only one output.
100
Evaluate y = 4x - 1 when x= -2
y = -9
100
A table of values for a linear function is given. Fill in the missing value.
x -1 0 1
y 3 8 ?
y = 13
100
A line has a slope of 1/3 and goes through the point (0, 8). What is the linear equation that represents this line?
The linear equation is y = (1/3)x +8
200
Mr. Harris attaches a small tank of propane to his portable grill. Then he turns on the grill and cooks food for a barbecue. Sketch a graph of the relationship between the amount of propane in the tank and time.
Decrease - straight line
200
Yes
200
A table of values for a linear function is given. Fill in the missing value.
x -21 0 21
y -4 -7 ?
y = -10
200
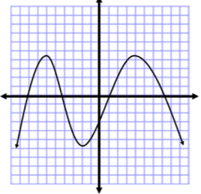
Does this graph represent a linear function?

No, it's a non-linear function!
200
An online clothing company sells custom sweatshirts. The company charges $6.50 for each sweatshirt and a flat fee of $3.99 for shipping. What linear equation represents this situation?
The linear equation is y = 6.5x + 3.99.
300
Liana hikes slowly away from her campsite for 30 minutes. Then she rests for 10 minutes. Finally, she hikes back at a faster pace, reaching her campsite in 20 minutes. Sketch a graph that could represent Liana’s distance from the campsite and time
Graph should include: Increase, constant, Decrease
300
Is it a function? {(2, 3), (4, 5), ( -2, 6), (-4, 5), (2, 7)}
NO, x repeats
300
Based on the function, what is y when x = -3?
y = -3
300
A table of values for a linear function is given. Fill in the missing value.
x 2 3 5
y 2 1 ?
y = -1
300
Re-write the equation into y=mx+b form:
y - 4 = -3(x - 3)
y = -3x + 13
400
he value of a stock decreases sharply for 2 weeks, increases sharply for 2 weeks, and then decreases sharply again for 2 weeks. Sketch a graph of the relationship between the value of the stock and time
Graph image should include: Decrease, increase, decrease, increase
400
Does the following table represent a function?
x y
1 2
2 5
6 2
2 9
5 1
No, because the input (x) of 2 has two different outputs (y)
400
A table of values for a linear function is given. Fill in the missing value.
x -1 0 1
y 3 -2 ?
y = -7
400
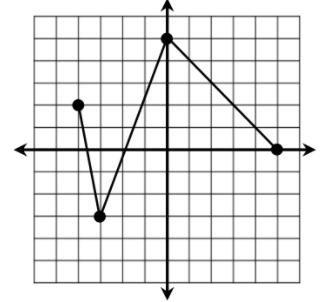
Does this graph represent a linear function?
Yes, it's a linear function!
400
What is the equation of this linear function? 
It is y = (-1/3)x + 5
500
A basketball player throws a ball upward from her hands, which are 5 feet above the ground. The basketball reaches a maximum height and then descends a few feet and becomes stuck in the net. Sketch a graph that could represent the relationship between the height of the ball and time.
Line starts above 0 and is an increase curve ending with a downward curve
500
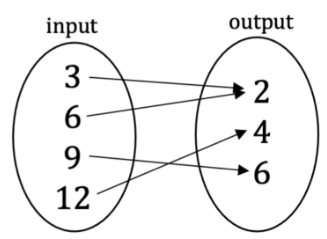
Is this a function?
Yes!
500
If y = 8 what is x if y = 2x + 4
x = 2
500
A table of values for a linear function is given. Fill in the missing value.
x 3 7 10
y -23 -55 ?
y = -79
500
 Write a linear equation to describe the table.
Interpret the slope and the y-intercept
y = 3x + 2
$3 per game
$2 to start