Scatter Plots
Graph Absolute Value Functions
Graphing Inequalities
100
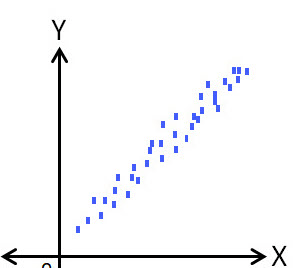 What correlation is this
What is (strong) positive correlation
100
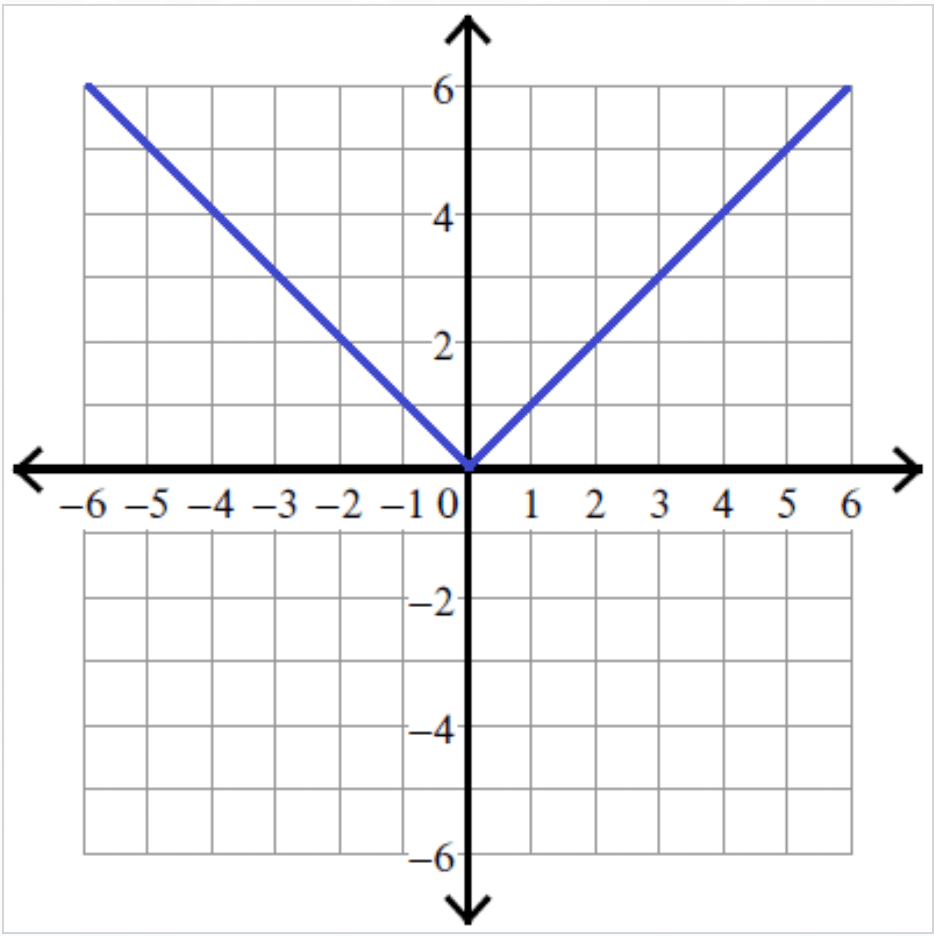
Graph the equation: y = |x|
100
Graph the inequality y > x-2
200
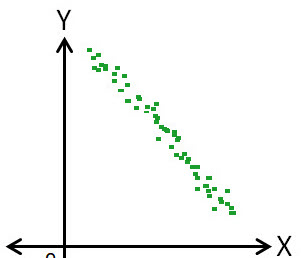
What correlation is this
What is (strong) negative correlation
200
Graph the equation: y = |x-1|
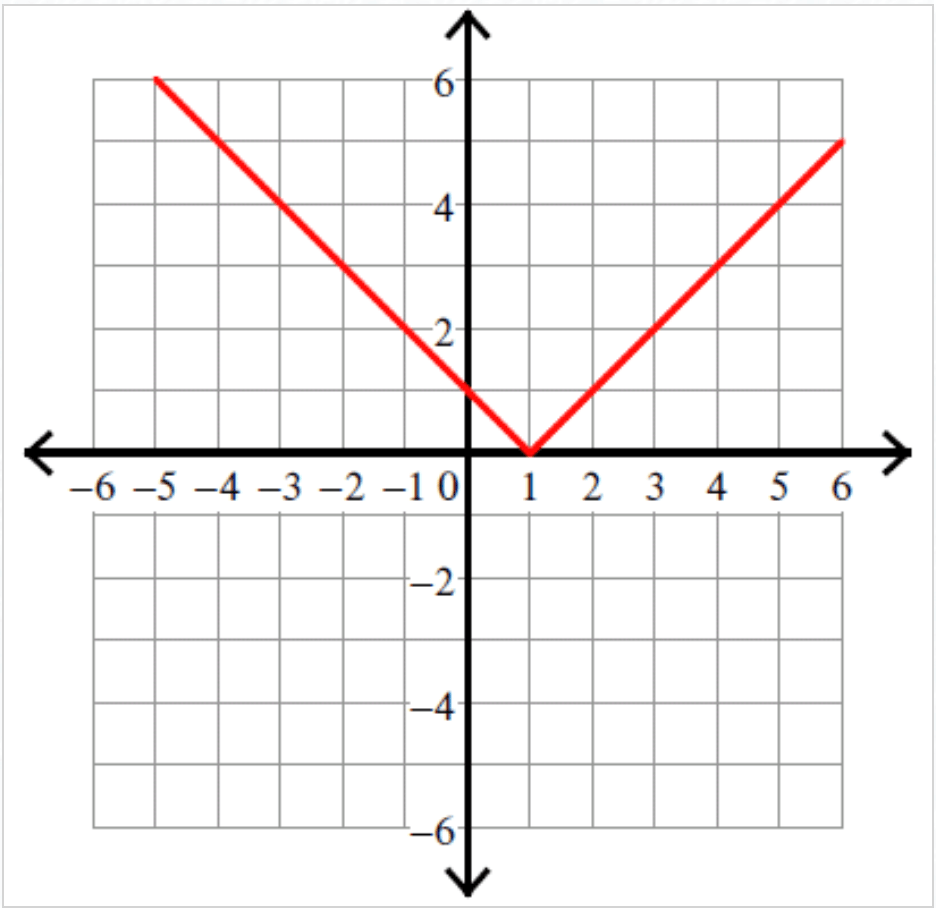
200
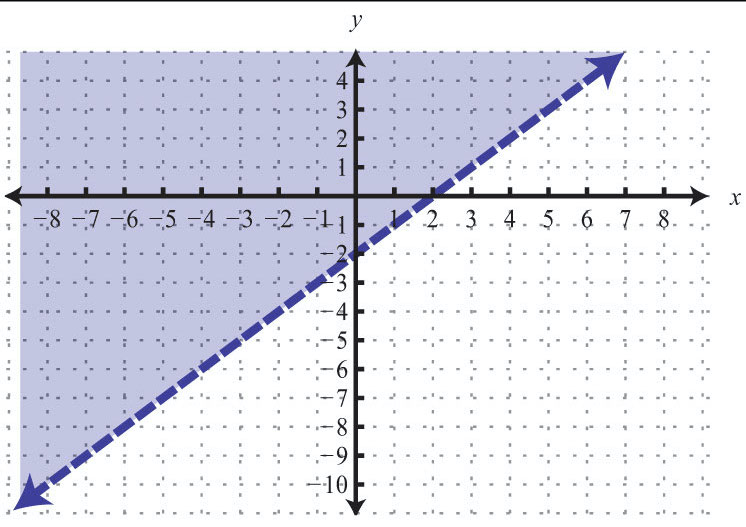
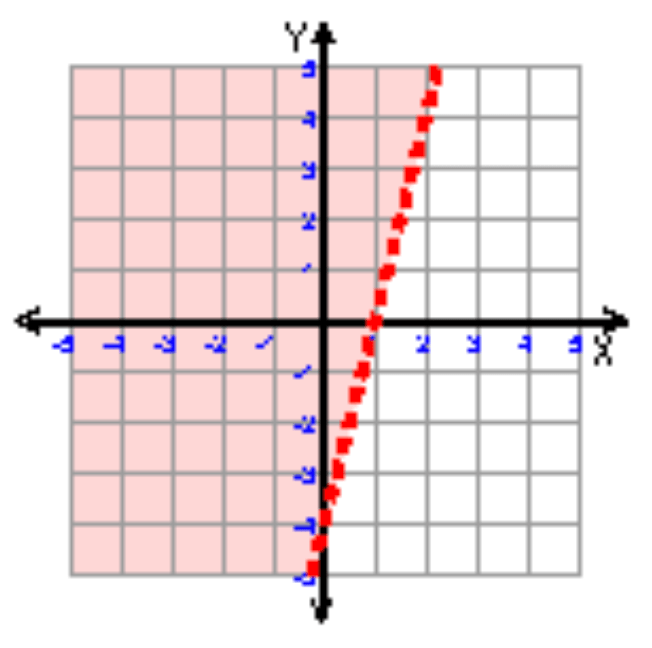
Graph the inequality y < 2x + 2

300
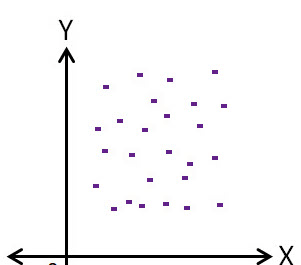
What correlation is this
What is no correlation
300
Graph the equation: y = |x-2|
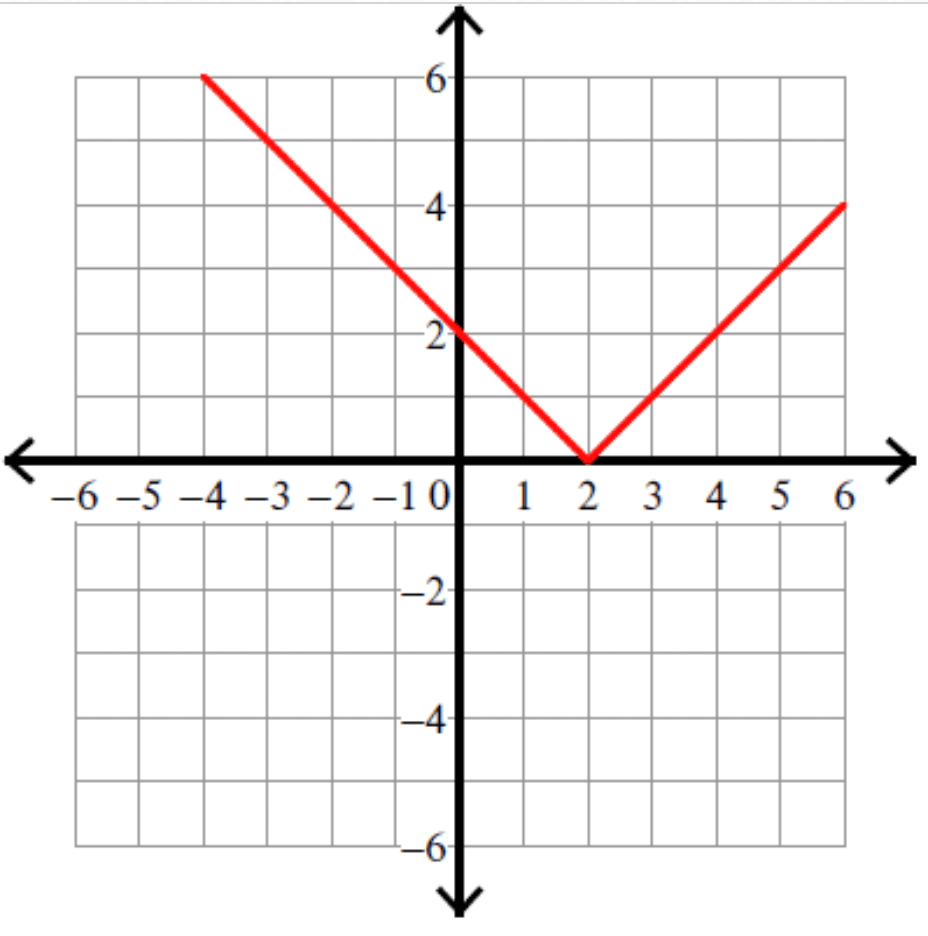
300
Graph the inequality y > 4x - 4
400
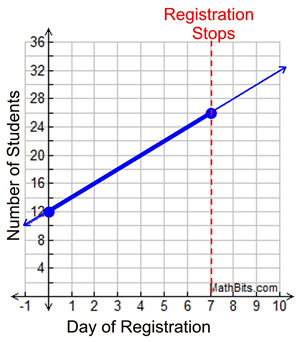 Based on this graph what equation can be created based on this trend line
What is y = 2x + 12
400
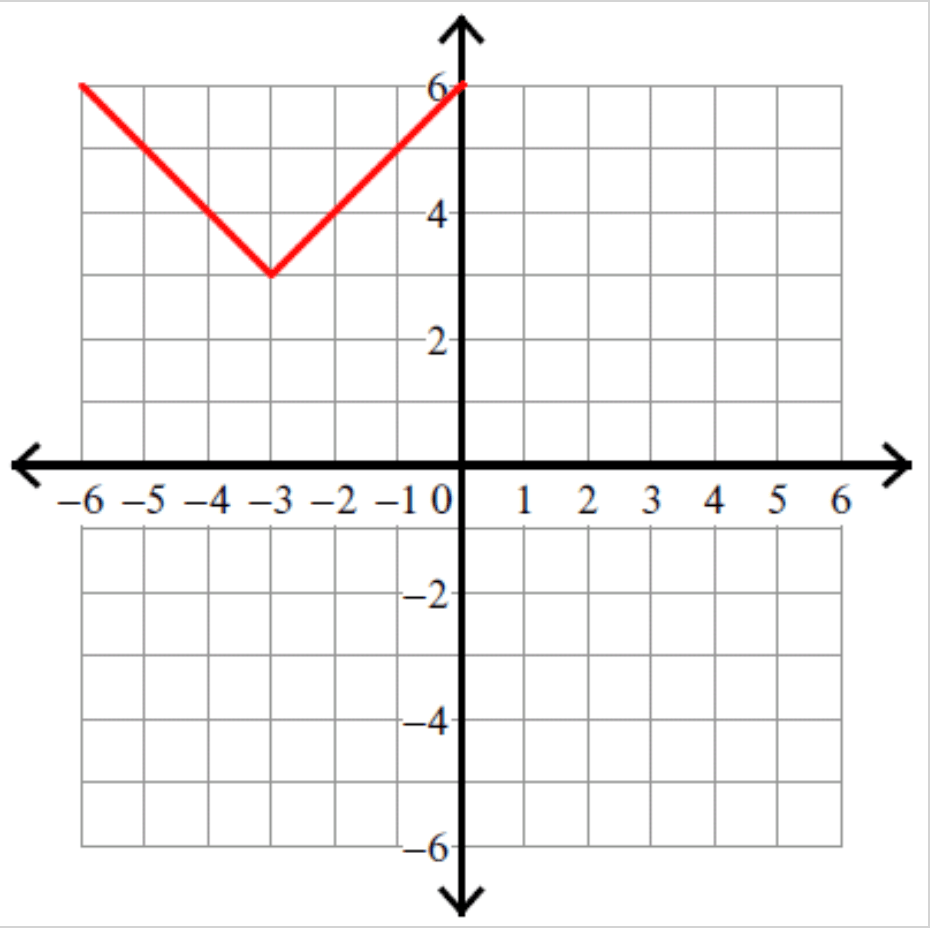
Graph the equation: y = |x+3| + 3
400
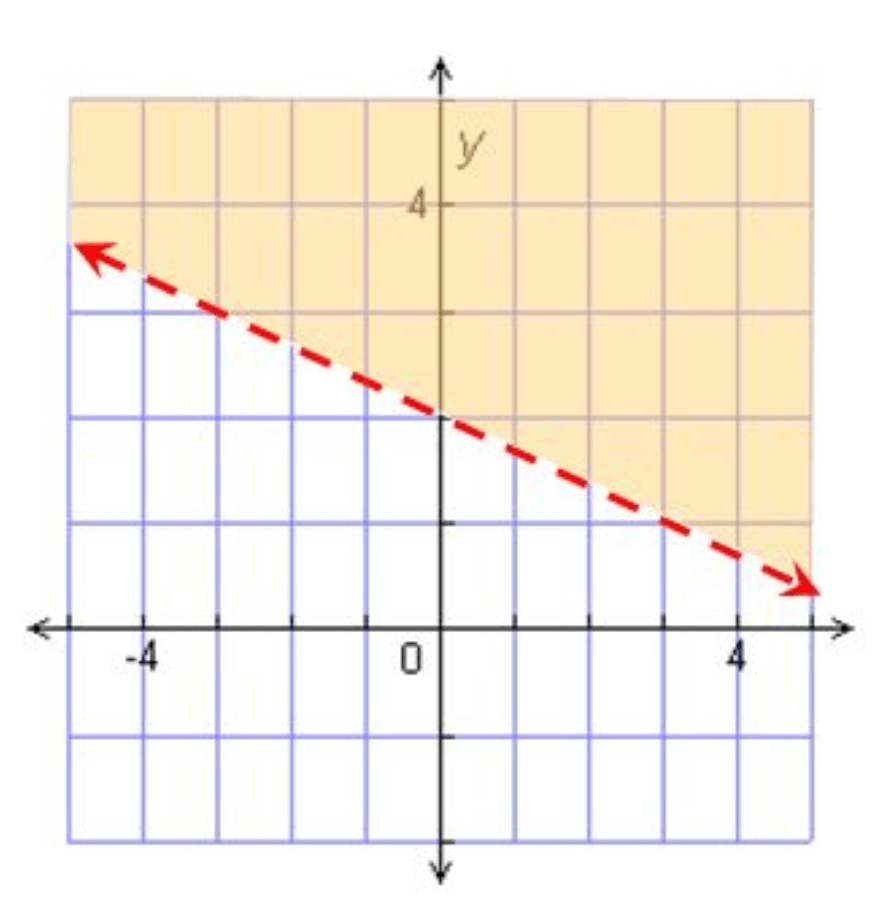
Graph the inequality y > -1/3x + 2
500


500
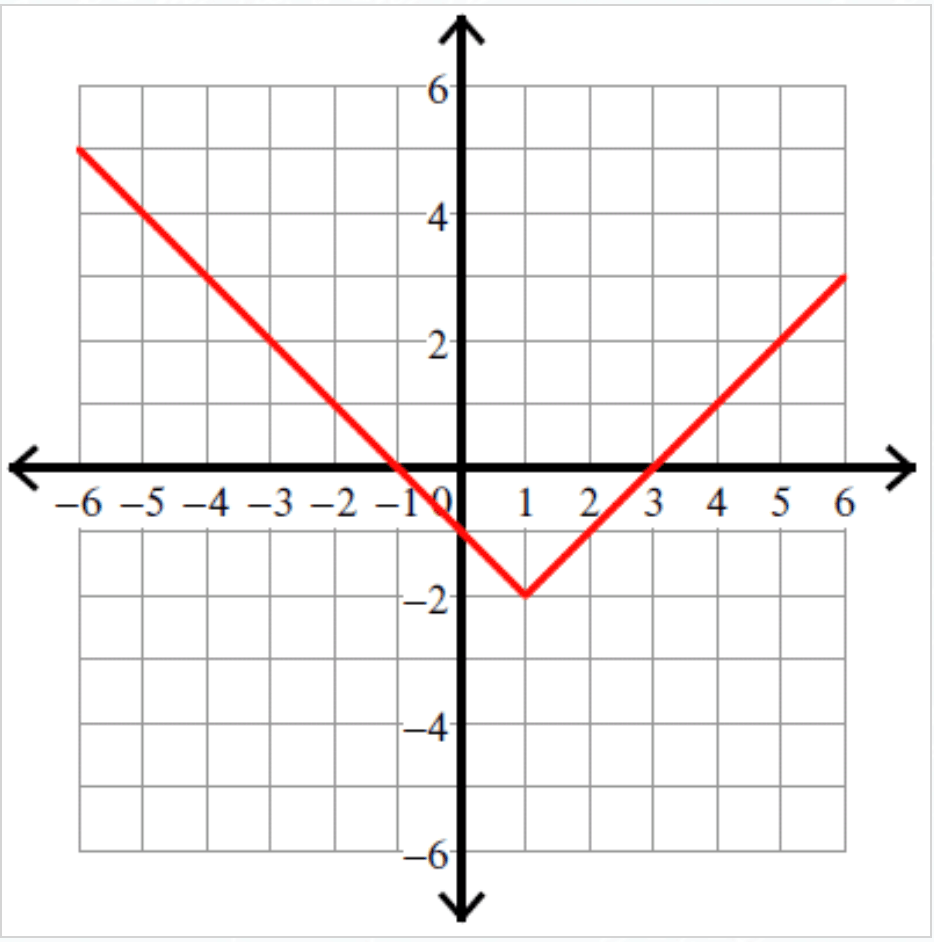
Graph the equation: y = |x-1| - 2
500
Graph the inequality y < 7/3x + 5
