Blast from the Past: Are You Having Fun(ction)?
Am I a function?
Box & Whisker Plots
REVIEW: Scatter Plots and Best Line of fit
Central Measurements of Tendency
Histograms
100
This "D" word used to describe the set of all inputs for a function.
What is the domain?
100
What is YES! NO input values repeat.
100
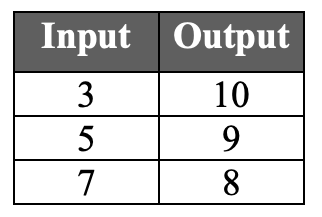
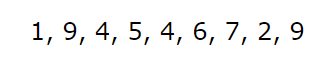
The range of this data.
What is 9 - 1 OR "8"?
100
When most of the points are close to the line of best fit, but one is very far, this is called an _______________.
Outlier
100
The data repeated most often.
Mode
100
The group with the fewest number of people.
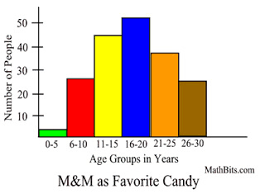
0 - 5 years old
200
This "R" word used to describe the set of all outputs for a function.
What is the range ?
200
Is this a function and why?
What is no, because x's repeat at 8?
200
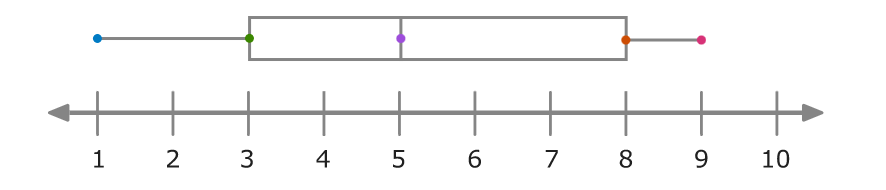
 The Lower Quartile "Q1".
What is 3?
200
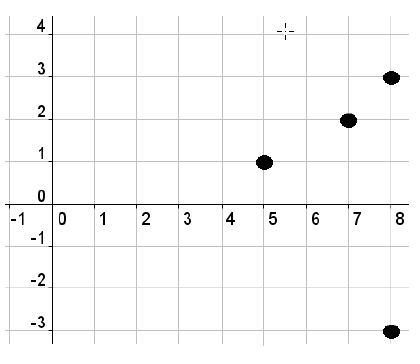
Find the equation of the line of best fit 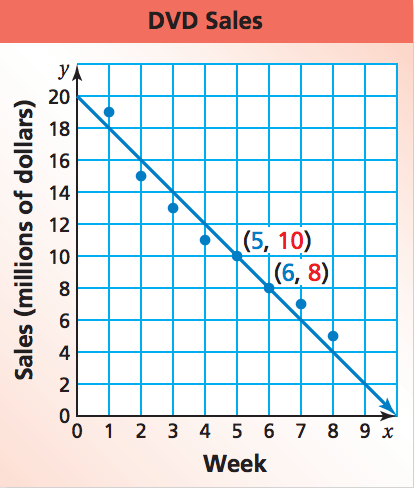
y=-2x+20
200
The difference between the maximum and the minimum.
Range
200
The group with the most people.

16-20 years of age.
300
Daily double: You can bet up to 600 points on...... This word describes a relation that pairs each x-value with only one y-value.
What is a function?
300
This graph is not a function.

What is Graph 1?
300
The Inner Quartile Range (IQR).

2
300
The equation of the line of best fit is y=-2.12x + 15.5, where x represents the age (in years) of an infant, and y represents the hours of sleep the infant needs. Use the equation to calculate how many hours of sleep an infant who is 6 months (0.5 years) needs.
14.44 hours
300
The process to calculate the mean.
Add all the numbers and divide by the number of data points.
300
The description of the data shape.

Skewed right.
400
What visual test can be used to determine if a graph is a function?
What is the Vertical Line Test?
400
Which of the following is not a function?
a.) (0,1), (1,2), (2,3), (3,4)
b.) (0,2), (1,3), (4,3), (1,2)
c.) (1,3), (4,2), (2,0), (3,4)
d.) (1,2), (2,2), (3,2), (4,2)
What is B.
1 can not have an output of 3 and 2
400
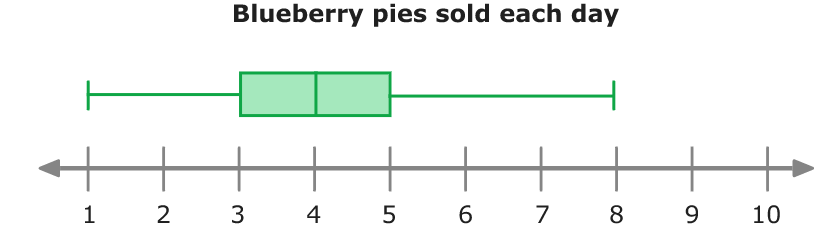 The median (Q2).
What is 4?
400
Name the correlation for this graph:
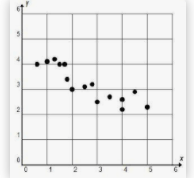
What is negative correlation?
400
The process to determine the median.
Arrange the data from least to greatest and find the middle.
400
The interval with the most grades, including the frequency.
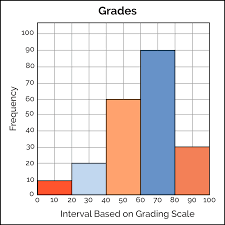
60 - 80 with a frequency of 90
500
What is special about the rate of change of a linear function?
It is constant. (a.k.a. it's the slope)
500
Which relation is NOT a function?
a.) (1,-5), (3,1), (-5,4), (4,-2)
b.) (2,7), (3,7), (4,7), (5,8)
c.) (1,-5), (-1,6), (1,5), (6,-3)
d.) (3,-2), (5,-6), (7,7), (8,8)
What is C
1 can't have a output of -5 and 5
500
The median for this data.
What is 5?
500
This describes the correlation between time running on a treadmill and calories burned.
What is positive?
500
How to determine the median in a set of even data points.
Average the two data points in the middle.
500
Description of the spread of data.

Symmetrical.
600
The value of x for the y-intercept.
What is when x = 0?
600
Is (2,5), (3,6), (4, 7) and (-3,6) a function?
YES
600
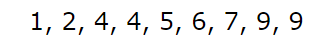
The Upper Quartile for this data. (Q3)
What is "8"?
600
An extremely reliable "correlation coefficient".
What is r = 1 OR r = -1?
600
The mean for this data:
5, 1, 3, 4, 14, 2
4.83 (3 repeats)
600
Two types of measurements to measure the spread of data.
Interquartile Range
Standard Deviation
Mean Absolute Deviation