Understand Functions!
Am I a function?
Rate of Change
Graph Features
Linear or Non-Linear?
100
How can you tell if a set of data is a function?
For every input, you have only one output.
100
YES! NO input values repeat.
100
Find the slope of the line below using rise/run.

Rise = 2
Run = 3
100
List your RANGE (outputs):
(2, 4), (3, 6) (4, 8)
(4, 6 , 8)
100
Is this linear or non-linear?
Non-linear
200
When writing our answer, what do we need to include in our writing?
Claim, Evidence, and Reasoning
200
Is this a function and why?
No, because 8 (input) has two outputs 3 and -3.
200
What is the formula for finding rate of change?
y2−y1/x2-x1
200
Find the DOMAIN (inputs):
{(-2, 4), (3, 2), (2, 10)}
What is {-2, 3, 2}?
200
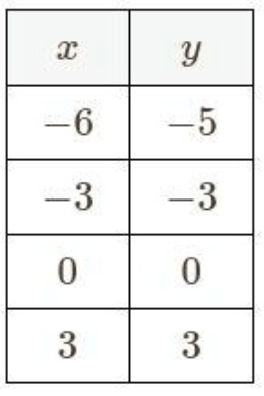
Linear or non-linear?
Linear
300
What is slope-intercept form?
What does each variable stand for?
y= mx+ b
m= Slope, Rate, Rate of Change, Constant Rate of Change
b= Y-Intercept, Starting Point, Initial Value, Constant
(x, y): Points
300
This graph is not a function.

Graph 1
300
A linear function has the rule shown:
Input (x): a number
Output (y): 7 more than 9 times x
Write an equation to represent the linear function.
y= 9x +7
300
The shaded region is increasing, decreasing, or constant.
Decreasing Interval
300
Is this linear or non-linear? If linear, what is the constant Rate of Change?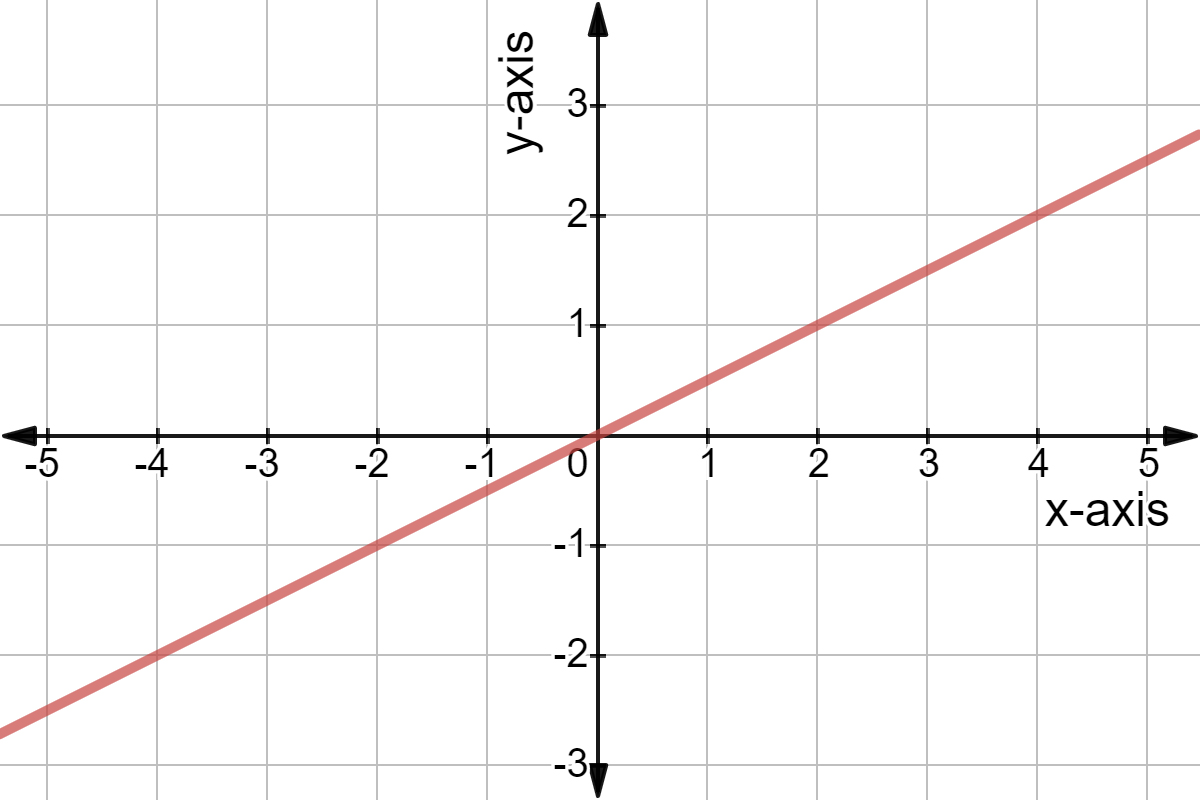
Linear Function
Rate of Change= 1/2
400
What visual test can be used to determine if a graph is a function?
What is the Vertical Line Test?
400
Which of the following is not a function?
a.) (0,1), (1,2), (2,3), (3,4)
b.) (0,2), (1,3), (4,3), (1,2)
c.) (1,3), (4,2), (2,0), (3,4)
d.) (1,2), (2,2), (3,2), (4,2)
B
1 can not have an output of 3 and 2
400
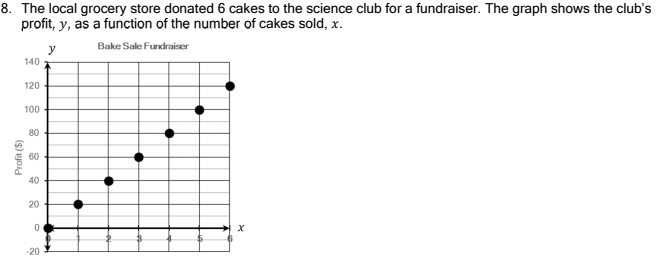
The table shows that the total cost of a ride-sharing trip, y, is a function of the distance traveled, x.
What is the rate of change and what does it mean?
Distance (mi), x: 0, 1, 2, 3, 4
Total Cost ($), y: 2, 5, 8, 11, 14
$3 per mile
400
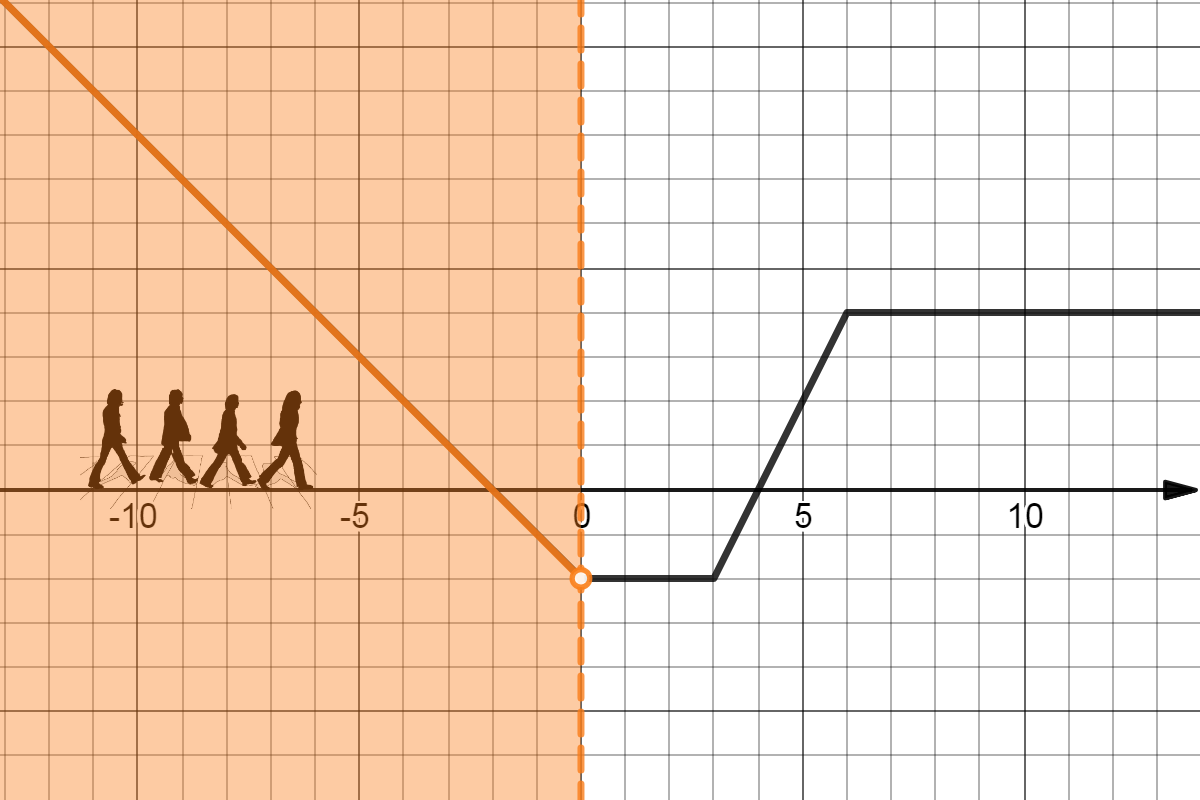
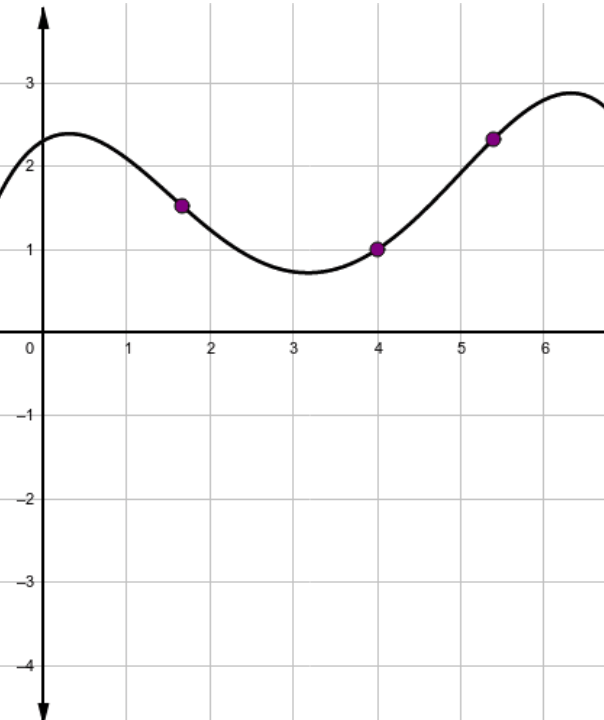
Find the two intervals of the graph shown.
Write the points.
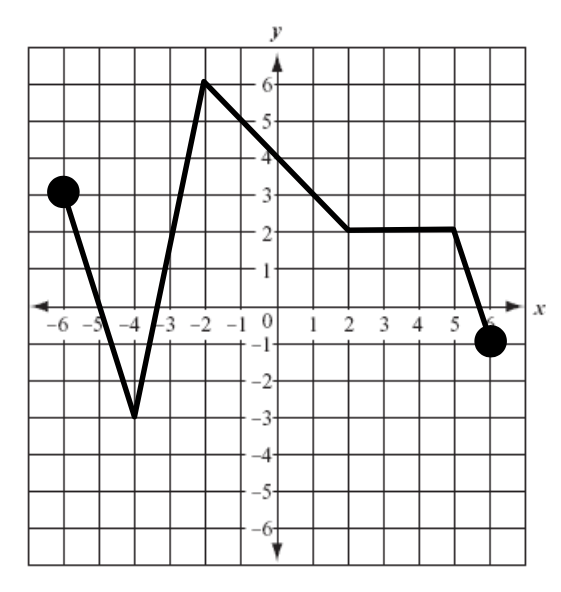
Starting Point: (-6, 3)
(-4,-3) , (-2,6), (2,2), & (5,2)
Ending Point: (6,-1)
400
Is this linear or non-linear? If linear, what is the constant Rate of change?
Linear Function
Rate of Change: 3/2
500
What is a Qualitative Graph?
A Qualitative Graph represents a relationship between quantities without numbers.
500
Which relation is NOT a function?
a.) (1,-5), (3,1), (-5,4), (4,-2)
b.) (2,7), (3,7), (4,7), (5,8)
c.) (1,-5), (-1,6), (1,5), (6,-3)
d.) (3,-2), (5,-6), (7,7), (8,8)
C
1 can't have a output of -5 and 5
500
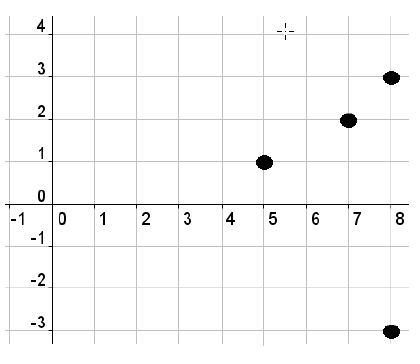
What is the rate of change between the points (4, -3) and (-1, 3)?
6/-5
500
Write an equation to represent the function.
y= 20x
500
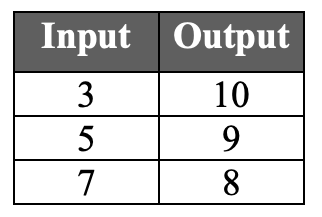
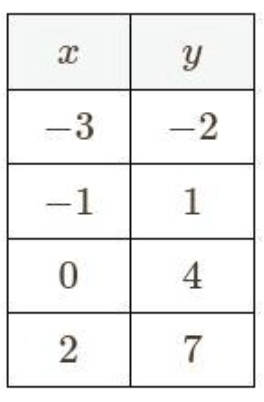
Does the table depict an linear or non-linear function?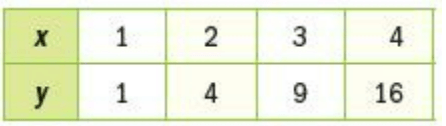
Non-linear
600
What are intervals?
The period of time between two points of time or events.
600
Is (2,5), (3,6), (4, 7) and (-3,6) a function?
YES
600
What is the average rate of change between x=-6 and x=3
8/9
600
What is happening to the function between the interval x=2 and x=3?
It is decreasing
600
Choice _______ is an equation of a linear function:
A) y=x2 + x + 1
B) y=2x-1
C) y= -3x2+ 2
D) y = x3
B