Find the domain and range of the following set:
{(9, 1) (-8, 0) (-1, 7) (0, 6) (-5, -7)}
D: {-8, -5, -1, 0, 9}
R: {-7, 0, 1, 6, 7}
Which sentence describes the relationship shown on this scatter plot?
A. As the temperature decreases, the visitors increase.
B. As the visitors increase, the temperature decreases.
C. As the temperature increases, the number of visitors increases.
D. No correlation
C. As the temperature increases, the number of visitors increases.
Describe the correlation between the number of lanes rented and the number of people bowling.
Positive Linear Correlation
All of the y values or outputs are called what?
Range
Is this graph a function or not a function? Why or why not?
Not a Function
X-values repeat, vertical line test failed.
Find the domain and range of the following set:
{(1, 1) (2, 0) (0, 3) (0, 6)}
D: {0, 1, 2}
R: {0, 1, 3, 6}
Is this line an accurate line estimate of best fit for the data?
Yes
Describe the Correlation for the graph.
Negative Linear Correlation
What is the definition of function?
Every input(x) has only ONE output(y)
or X values do not repeat
Is this table a function or not a function?
Not a Function
Find the domain and range of the following:
{(0, 1) (0, 2) (0, 0) (0, -2) (0, -8)}
D: {0}
R: {-8, -2, 0, 1, 2}
Describe the relationship of each graph.
A.
B.
C.
A. No relationship
B. Positive Linear Relationship
C. Negative Linear Relationship
Independent variable(x) and Dependent variable(y) both Increase
What is the domain of the function given by the set of points: (3, 7), (6, 2), (9, 5), (12, 8)?
{3, 6, 9, 12}
Which set of values is a function?
1. (9,5) (10,5) (9,-5) (10,-5)
2. (3,4) (4,-3) (7,4) (3, 8)
3. (6,-5) (7, -3) (8, -1) (9, 1)
4. (2, -2) (5, 9) (5, -7) (1, 4)
3. (6,-5) (7, -3) (8, -1) (9, 1)
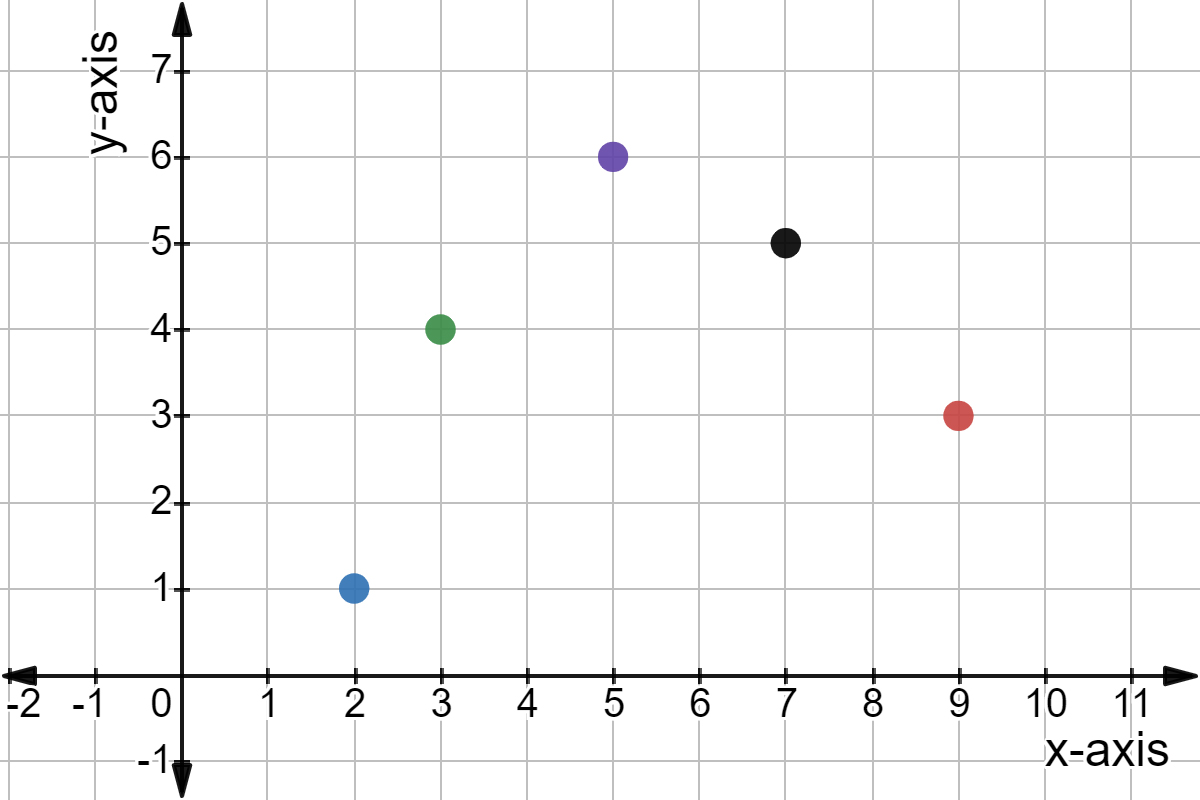
What is the domain of the following? Think about what domain is...

{2, 3, 5, 7, 9}
Which scatterplot shows the correct trend line (line of best fit) for the relationship showing the number of bags of chocolates that are sold and the price per bag?
B. Chocolate Sales
Describe what happens to my independent variable(x) and my dependent variable(y) when there is a negative correlation.
Independent variable(x) increases and Dependent variable(y) decreases.
Which of the following lines represents the line of best fit for the scatter plot?
B.
Which set of ordered pairs represents a function?
A) {(1,2),(2,3),(3,4),(1,5)}
B) {(4,5),(4,6),(7,8)}
C) {(2,3),(3,4),(5,6)}
D) {(0,1),(1,2),(1,3)}
C) {(2,3),(3,4),(5,6)}
What is the range of the following? Think about what range is...

{1, 3, 4, 5, 6}
Which scatterplot shows the correct trend line (line of best fit) for the relationship showing the number games played and attendance in the Small Fry Baseball Tournament?
Z.
What type of correlation does this graph have?
No relationship
All of the x values or inputs are called what?
Domain
Is this graph a function or not a function?
Not a function


