Functions
Graphing functions
Evaluate Functions
Linear Functions
100
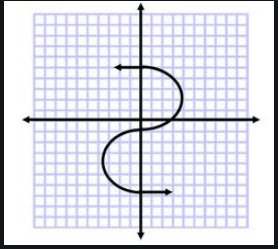
Does this graph represent a function or not? Explain.
Not a Function. It does not pass the vertical line test. There are x-values with more than one y-value.
100
Graph f(x) = -2/3 x + 1
100
Evalutae h(x) = 3x - 24
for h(-2)
-30
100

Write the linear function.
f(x) = 6x
200
State the domain.

all real numbers
200

Evaluate the function t(x) for t(3).
4
200
Write a function for the values in the table.
f(x) = 2x - 7
300
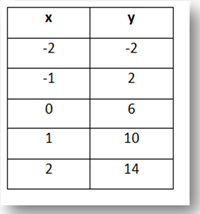
List the values of the range.
-2, 2, 6, 10, 14
300

Evaluate the function p(x) for p(0)
4
300
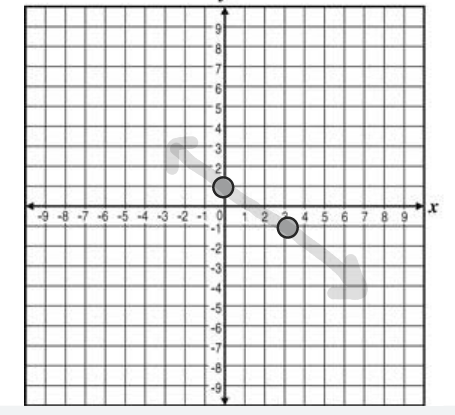
What is the linear equation in slope-intercept form of this function?
y = (-1/3)x + 5
400
If the ordered pair (5,6) is added to the graph, will it be a function or not? Explain.
Not a function. One input 5 has two outputs (0 and 6).
400
Evaluate the function for f(5)
f(x) = 2x2 - 3x + 7
42
400
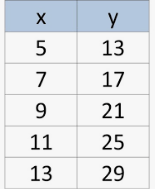
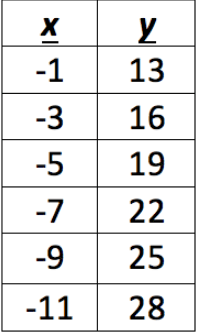 Write the equation in function notation. Leave numbers as integers or fractions.
f(x) = -3/2x + 23/2
500
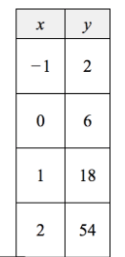 Does the table represent a linear or nonlinear function? Explain.
Nonlinear. The pattern does not add a constant amount in the y-column.
500
Evaluate the function j(x) for x = -3
j(x) = -4x2 - x - 1
-34
500
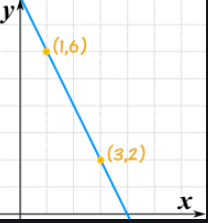
Write the function given the 2 points on the graph. Then evaluate the function for f(21).
f(x)=-2x+8
f(21) = -34