Review Problems
Bar Graphs
Tally Charts
Line Plots
Picture Graphs
100
12 + 45
57
100
How many people voted for their favorite movie genre?

20 people
100
Draw a frequency table for this tally chart.
Tiger- 15
Giraffe- 7
Elephant- 7
Deer-11
100
How many students sold 3 or less candy bars?
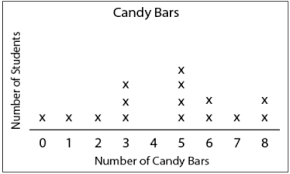
6 students
100
How many students played football?
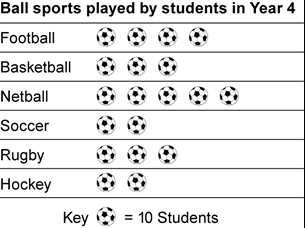
40 students
200
40.1 - 2.78
37.32
200
Which two sports combined for a total of 56 votes?

Football and Hockey
200
How many people like cherry flavor?

17 people
200
On which day is theleast car sales?

On Thursday.
200
If five more students voted for writing, how many pencils would need to be drawn?
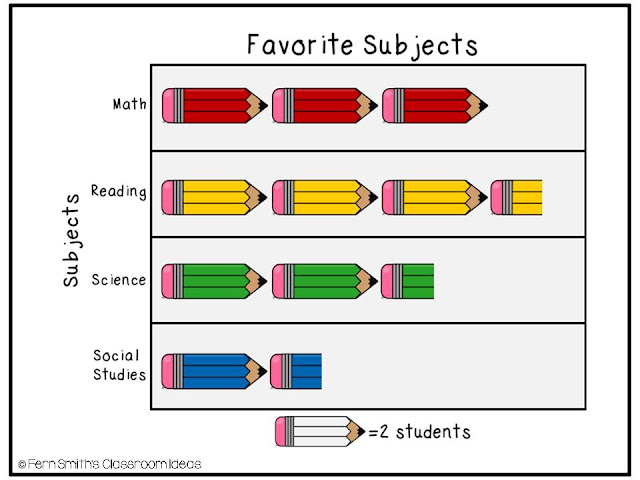
2 wholes and 1 half
300
27 x 11
297
300
How many more students would need to vote for yellow to equal the votes for blue?
3 more votes
300
How many students voted for cats or goldfish?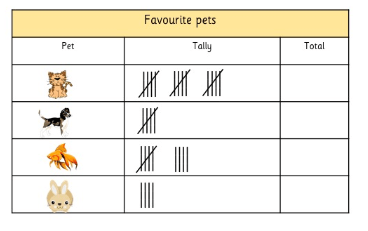
24 students
300
How many students are more than 51 inches tall?
4 students
300
How much milk was sold on week 2 and week 4 combined?

3 bottles of milk
400
After a weekend of shopping I spent IDR 150k at TransMart and IDR 375k at Matahari. How much did I spend in all?
150,000 + 375,000 = 525,000
400
How many students own a dog or a hamster?
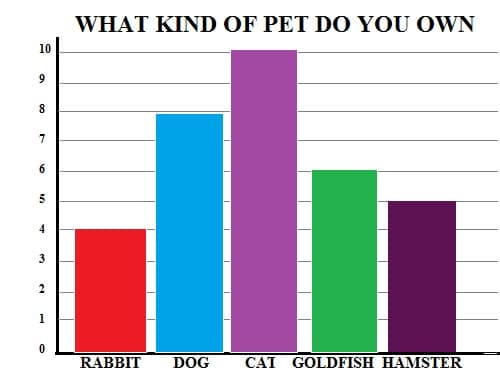
13 students
400
Brendan is going to use this data to create a bar graph, which fruit will have the longest bar?
![]()
Orange
400
How many students voted for hockey or gymnastics?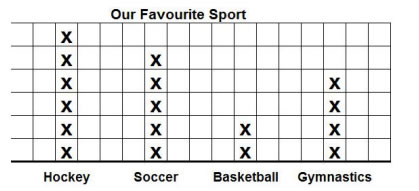
10 students
400
How many fewer apples were sold in Mar/Apr then in Jan/Feb?

5 fewer apples
500
The Whites are going on a road trip. The trip is 562 km. They have driven 239 km. How many more kilometers do they need to drive?
562 - 239 = 323
500
If there are 27 students in the classroom, how many students did not vote?

5 students
500
If there are 24 students in the classroom, how many students do not like pets?

4 students
500
How many more cars were sold on Friday than Thursday and Sunday combined?

1 more car
500
How many students voted about their favorite season?

33 students