1.1 London Cholera
1.2 Meet GIS
1.3 Crime Fighting
1.4 More About Data
1.5 Other Uses
100
In the 19th Century in London, people had smelly pits under their homes where toilet waste would go. What were these called?
cesspools
100
What does GIS stand for?
geographic information system
100
What is an offender? What is a victim?
Offender commits (does) crimes, victim has something bad happen to them because of the crime
100
For GIS, each type of data has its own ______
layer
100
How can GIS be used to make parcel delivery more efficient?
helps plot the quickest route
200
VOCAB! What word do we use to describe a relationship/connection between two different things?
correlation
200
According to page 8, what are the four parts of the geographic information system?
a computer, GIS software, the map, data you want on the map
200
Look at 1436. What happened here? Why do you think?
mugging- lots of bushes
200
What does GPS stand for and what useful information does it give us?
global positioning system- it gives us the latitude and longitude coordinates of a feature
200
What does sat nav stand for? What does it help you do?
Sat nav stands for satellite navigation and helps you find/get to places
300
GIS maps are made of layers. What were the three layers of the cholera case map? (look at pg. 7 of your book for extra help)
a base map of London, deaths from cholera (red), water pumps (blue)
300
What are examples of data you might add to a GIS map?
addresses, crime scenes, forest fires, etc etc
300
The houses on the left of Dante avenue are burgled (robbed) much less than the ones on the right. Why?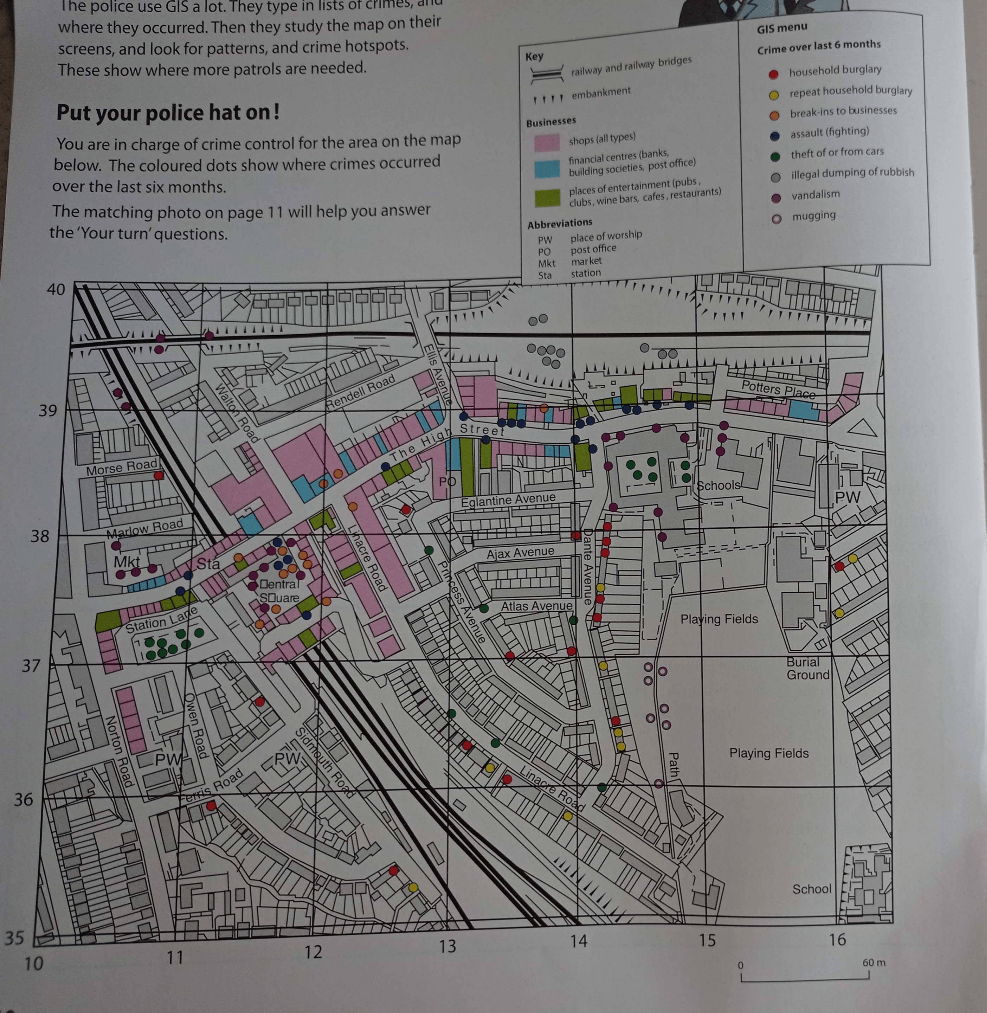
There is a car park with lots of cars left for long periods of time.
300
What do latitude and longitude tell us? How can we get this information?
Longitude are vertical (LONG) lines that tell us what the east/west position is
Latitiude are horizontal (FLAT) lines that tell us what the north/south position is
we can get this from things like GPS and postcodes (letters and numbers added to an address to help mail delivery)
300
How can GIS be used to make good decisions to save chimps?
It can help determine where chimps live so that area (and the chimps) can be protected without having to move them.
400
What correlation did John Snow make to stop the cholera outbreak?
that cholera deaths were more concentrated around certain water pumps
400
Look at map A. Flood warnings go from a mid-range level two to a more serious level three. What would you change about the layers of the map (section B)? How might the map look different when you make these changes?
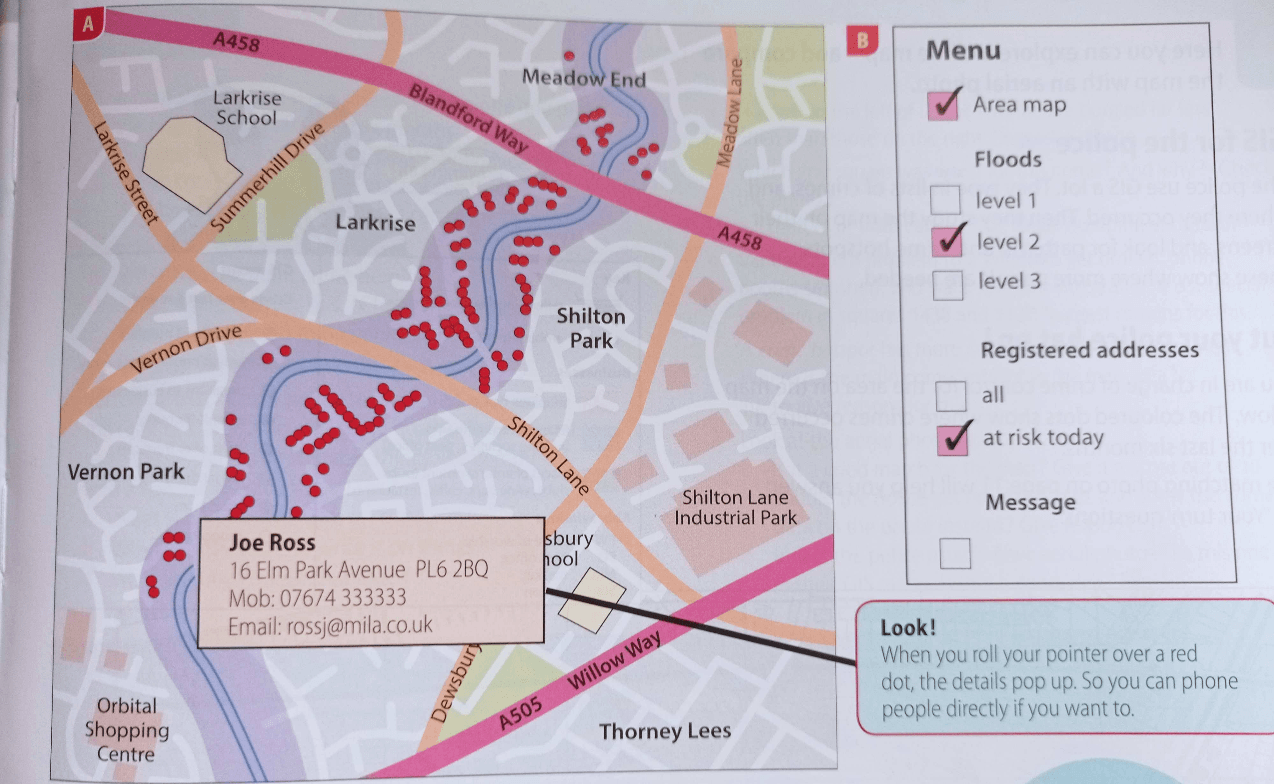
unclick level 2 and select level 3
the purple flood area is likely to be wider, with more red dots of homes impacted
400
Where is a crime hotspot on this map? Name two spots
1137, 1438
400
What can you do with GIS layers? Why is this helpful?
turn layers on and off
put together layers to make correlations
make changes to layers
add more layers
This allows us to display and connect information, even as the information changes over time!
400
How can GIS help save lives?
Ambulance example, cholera example, flood example, etc
500
Suppose that Dr Snow had NOT drawn the pumps in. Would his map still have helped solve the puzzle? Why or why not?
It may have been possible to solve this had they gone to the streets where cholera deaths were found, but it would have been MUCH more difficult to make the correlation that solved the problem.
500
In what ways is this GIS map better than the old maps Dr. Snow made for cholera in the 19th Century?
it's easier to see a correlation with GIS maps,
you can see more detailed information,
it is easier to change between layers,
as you have the internet and the contact details of families that would be impacted, you can warn people likely to be impacted, etc
500
Give other examples of how we can fight crime using GIS not from the book.
We can look at old maps to solve cold case files, we might be able to see unusual images on satellite, we can look at crime scenes to maybe determine who the criminal is, etc etc.
500
Describe the steps of creating and using a GIS map.
Start with a base map
Gather data
Create layers for each type of data
Map the data on as points (dots) or vectors (shapes) onto the layers using latitude and longitude (you can get this from things like GPS)
Play with the layers to find correlations
500
Give one example NOT in your book that GIS can be used for- it can be something we discussed in class.
student answer- such as fires in California, floods in Houston, cold case files, etc.