Bar Graphs
Double Bar Graph or stacked
Line Graphs
Histogram
Cartesian Plane
100
What is this graph showing?
Favourite types of movies.
100
What are they showing in this graph?
Flavour preferences by Gender.
100
What is missing from this graph?
X and Y axis titles
100
What is the difference between a bar graph and a histogram?
Bar Graph- Qualitative
Histogram- Quantitative
100
In quadrant 1 your coordinates will be a positive and a positive.
True
200
What is the scale on this graph?
Going up by 2's
200
What flavour was the most popular among girls?
Chocolate.
200
What is the scale of this graph?

Counting by 1's
200
What is the topic of this graph?
M&M as favourite candy among different age groups.
200
What are the coordinates of A?
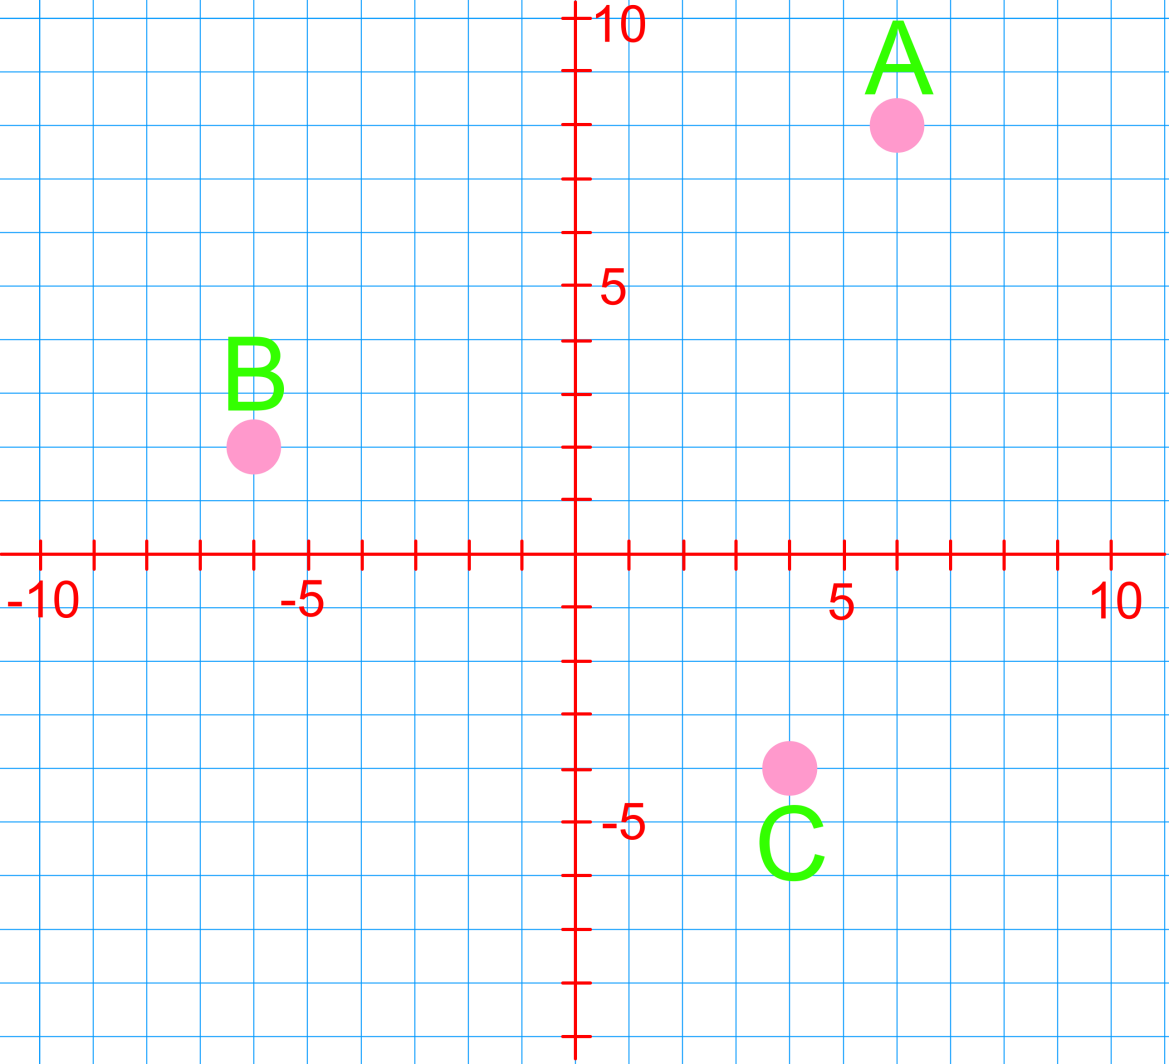
(6,8)
300
What is this bar graph called? (the direction the bars are going).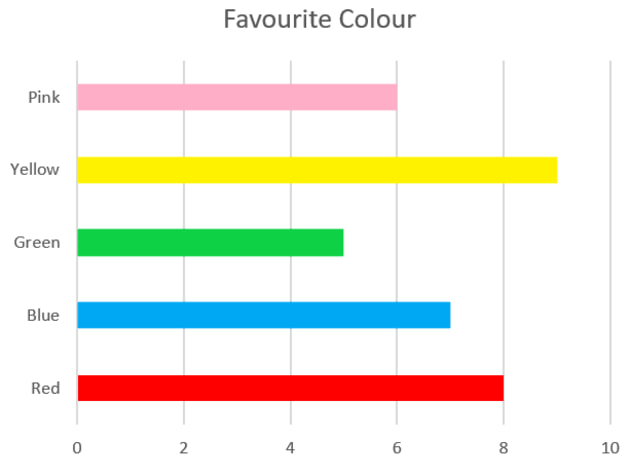
Horizontal bar graph
300
What flavour was most popular among boys?
Vanilla.
300
What day had the least amount of donuts sold?
Tuesday.
300
What unit of measurement is being used?

centimeters
300
What are the coordinates of B?
(-6,2)
400
What is the least liked color?
Green.
400
What is the title of this graph?
Projected International Population to 2023.
400
Is this qualitative or quantitative data?
Quanitative.
400
What is missing?
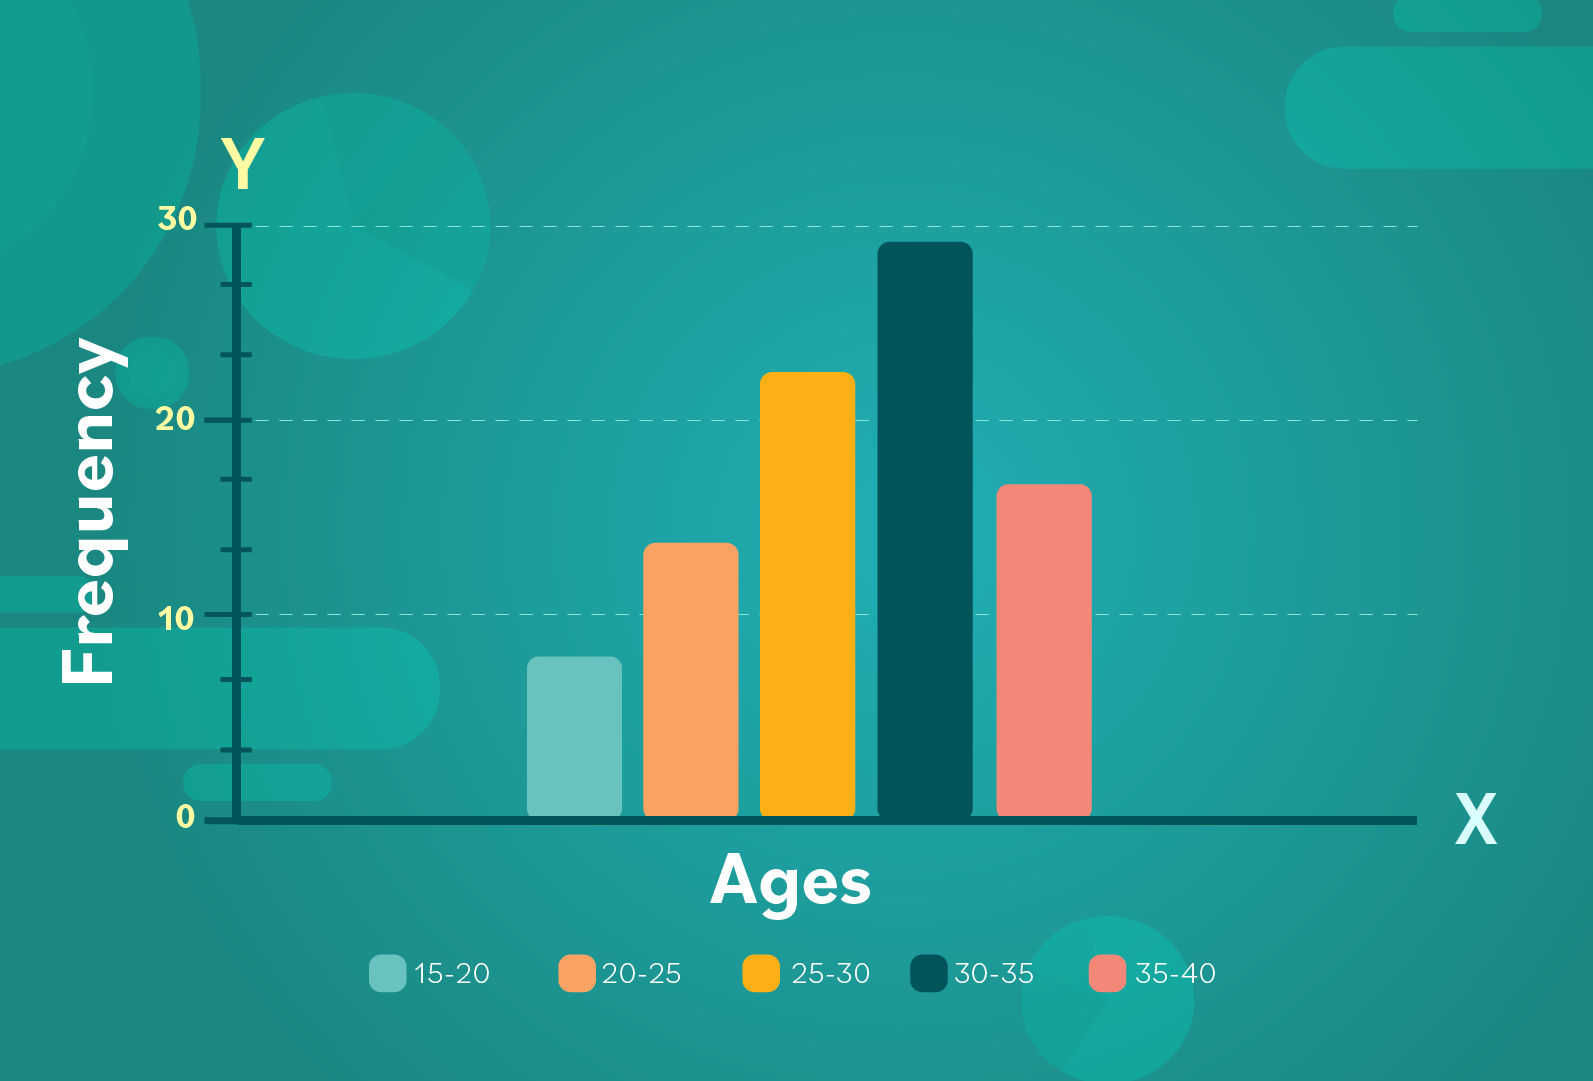
The title
400
What are the coordinates of C?
(4,-4)
500
What is missing in this graph?
Titles for the X and Y axis.
500
Who has the highest increase in population growth by 2030?
Non-OECD Asia.
500
In 2017 which animal had the lowest population?
Bears.
500
At around what age do people win Best Actress award?
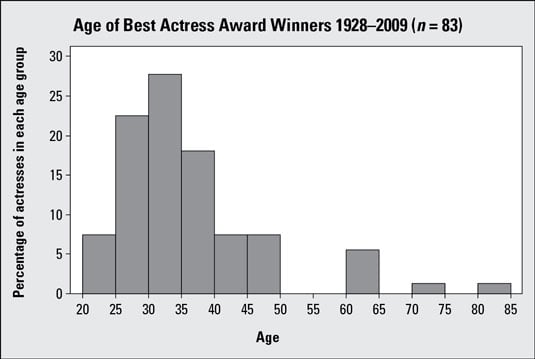
Between 30-35.
500
What are the coordinates of the origin?
(0,0)