Types of Graphs
Interpreting Pie Graphs
Interpreting Different Types of Graphs
Misleading Graphs
Continuous vs. Discrete
100
This type of graph is best for showing the proportion of different parts to a whole.
Circle Graph
100
If a slice in a circle graph takes up half of the circle, what percentage does it represent?
50%
100
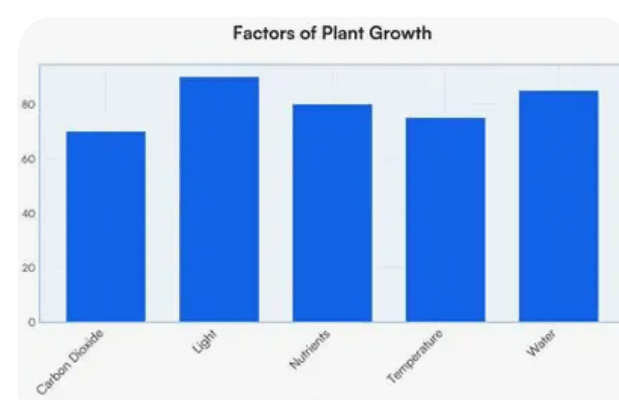
A bar graph shows factors affecting plant growth. Which factor has the biggest effect?
Light.
100
What is one way a graph can be misleading?
By not having a clear title or labels, by using an inappropriate type of graph or by having an inappropriate scale.
100
Which type of data can be counted in whole numbers (like the number of students in a class)?
Discrete data
200
This type of graph represents data as a series of horizontal steps, showing constant values over intervals and abrupt changes at specific points
.
Step graph
200
If a circle graph shows the favourite ice cream flavors, what does the size of each slice tell you?
The proportion (or percentage) of people who chose that flavour
200
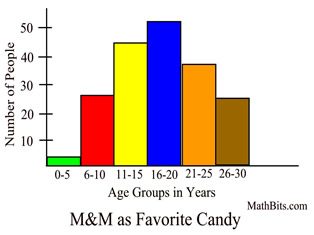
What information can you easily see by looking at the bars in a histogram?
What the ranges of values are and how many fall into each range
200
If the y-axis of a bar graph doesn't start at zero, how could this make the graph misleading?
It can make the differences between the bars look much larger than they actually are.
200
Which type of data can take on any value (including decimals) within a range (like a person's height)?
Continuous data
300
This graph uses points connected by lines to show how data changes over time.
Line Graph
300
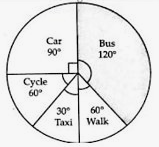
What is the most and least popular mode of transportation?
Bus is the most
Taxi is the least
300
If a distance time graph shows a steady increase over several hours and then declines, what is happening to the distance travelled?
The traveller is returning to their origin.
300
How can changing the scale on the axes of a graph make it appear that there is a bigger or smaller difference between data points?
It can exaggerate or minimize the changes or differences in the data.
300
Give an example of discrete data.
The number of students in a class, the number of cars in a parking lot, or the number of pets a person owns
400
This graph uses separate rectangular bars to compare different categories of data.
Bar Graph
400
How can you estimate the actual number of people in a category if you know the percentage and the total number of people surveyed in a circle graph?
Multiply the percentage (as a decimal) by the total number of people.
400
If a line graph shows a steep downward trend, what does that indicate about the data?
The data is a decreasing trend
400
What should you always check when looking at a graph to avoid being misled?
The title, labels on the axes, and the scale of the axis
400
Give an example of continuous data
The actual measurements or observations collected (e.g., the specific heights of plants, the exact test scores of students)?
500
This is a way of organizing data in columns and rows to show the frequency of each value or category.
Frequency Table or Two- Way Table
500
What is one advantage of using a circle graph to display data?
It clearly shows the proportion of each category in relation to the whole.
500
What is the main purpose of a frequency table before you create a graph?
To organize the data and see the frequency of each value before choosing the best type of graph to display it.
500
Give an example of how a graph might use pictures instead of bars to make comparisons misleading.
For example, if you use pictures of different sizes to represent quantities, the area of the pictures might be misleading instead of just the height.
500
What is one graph you would use to graph discrete data?
What is the graph you would use to graph continuous data?
Discrete: bar graph or pie chart
Continuous: line graph or histogram