GR 8 Which Rate?!
GR 8 Population Distribution/Density
GR 7 Landform Regions
GR 7 Elevation
GR 7/8 Thinking Like a Geographer
100
The rate that represents the number of live births per thousand people every year.
Birth Rate
100
What type of population distribution is represented in this image?
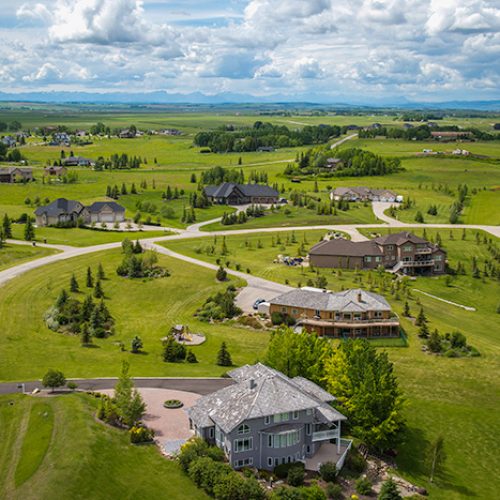
Scattered Population Distribution
100
A large, flat to gently rolling region
Plains
100
What is elevation?
The height of a location or object above sea level.
100
What are the three framing questions we ask when exploring concepts in GEOGRAPHY?
What is WHERE?
Why CARE?
Why THERE?
200
A number that shows the increase or decrease in a population during a certain period of time.
Growth Rate
200
Describe the population density in the photo below.

Sparse
200
What is an opening in Earth's crust from which molten rock or magma escapes to reach the surface?
Volcanic Mountain
200
What two ways can we show ELEVATION on a map?
We can show ELEVATION using contour lines or colours.
200
What is GEOGRAPHY?
The study of WHERE.
Geographers ask about the relationship between the physical environment and the people who live on this planet!
300
If the Birth Rate is higher in a country than the Death Rate. What will happen to the population?
The population will increase because more babies are being born and less people are dying.
300
What type of population distribution is represented in this image?
Peripheral Population Distribution
300
What do you call high, flat region that has been lifted up by movement of Earth's surface?
Plateau
300
What landform might this map be showing?
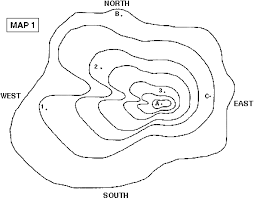
How do you know?
Mountain Landform Region using Contour Lines!
300
When asking questions in Geography, what type of questions do we want, OPEN or CLOSED?
Why?
Open Questions allow us to dive deeper into our understanding! They help us explore different perspectives and gather information in order to answer them!
400
Describe the birth rate and death rate from 1950 - 2017 using the information from the graph.
This demonstrates a positive growth rate! We can assume that this means the birth rate is higher than the death rate.
400
Describe the population density in the photo. 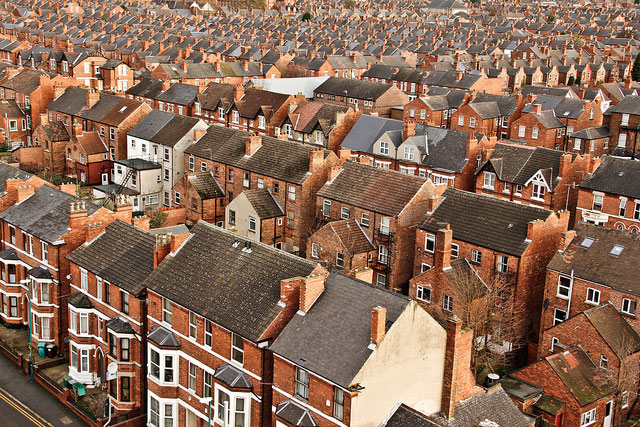
Dense
400
What are the natural features that make up Earth's surface?
Landforms
400
What do the colours on this map tell us about the Island of Hawaii?

The colours show us elevation using the legend provided! We can see 2 major areas of high elevation on the island!
400
Interrelationships is one of the four categories of "Thinking Like a Geographer".
What does this mean and how does it help us analyze a case study?
Interrelationships are the connections between different parts of a system, such as between human and physical environments.
500
Describe the difference in population growth in 1950 to population growth in 2010 using the information on birth and death rates provided. 
In 1950, high birth rate, low death rate so there is a high growth rate and the population is growing rapidly.
In 2010, the birth rate and death rates are closer together. Birth rate is still higher so the overall population is still growing but much slower than in 1950.
500
What does "Carrying Capacity" mean?
Carrying capacity measures the maximum population that can survive without using up resources in the region.
500
What is the base rock of an ancient mountain region that has been worn away, leaving a flat, rocky landform region?
Shield
500
What type of map shows ELEVATION?
A Topographic Map shows elevation.
500
Spatial Significance is one of the ways we can "Think Like a Geographer".
What does this mean?
Spatial significance refers to specifically where places are located on the planet.
It also explores the importance of a place and those things around it.