Which Rate?!
Population Distribution
What does this mean?
Population Density
100
The rate that represents the number of live births per thousand people every year.
Birth Rate
100
What type of population distribution is represented in this image?
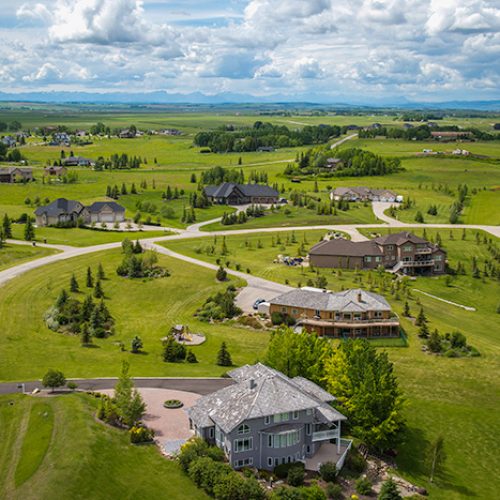
Scattered Population Distribution
100
What is represented in this map?

Population Density - the number of people that live in a given area
100
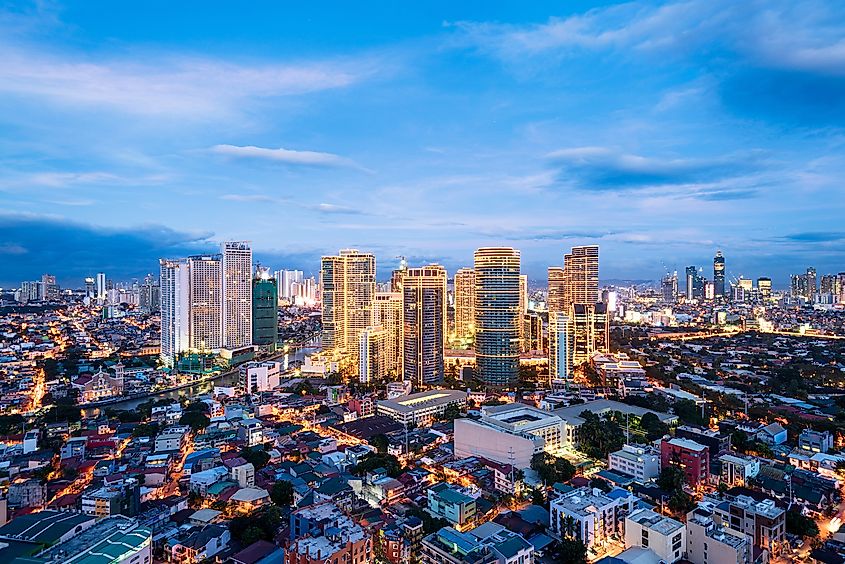
Urban or Rural?
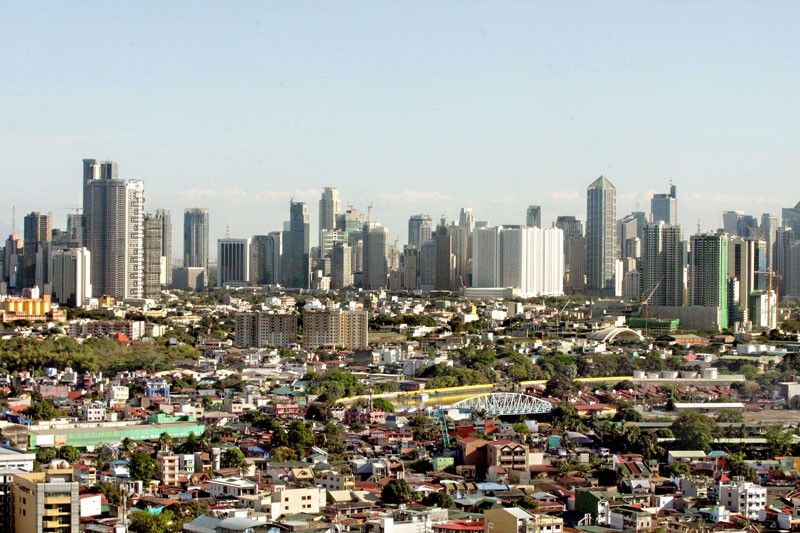
Urban
200
A number that shows the increase or decrease in a population during a certain period of time.
Growth Rate
200
What type of population distribution is represented in this image?
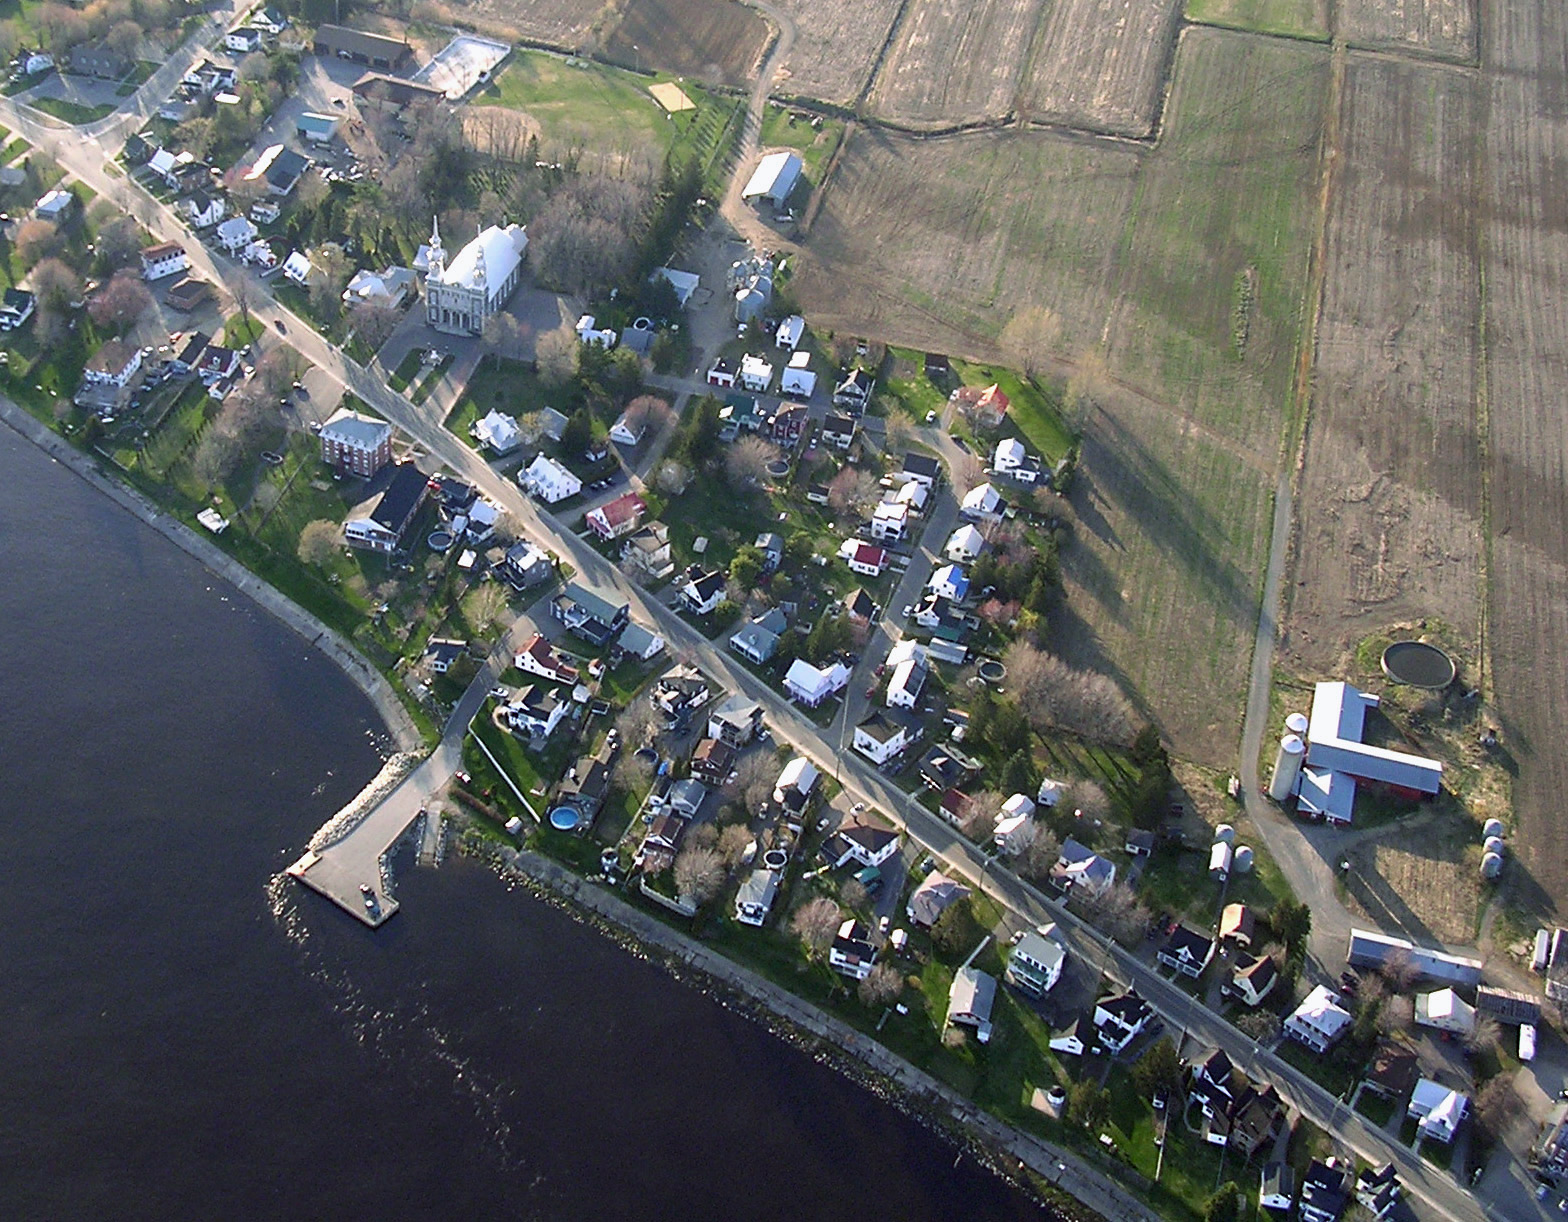
Linear Population Distribution
200
What is represented in this image?

The Population Growth Rate of several countries
200
Urban or Rural? 
Rural
300
If the Birth Rate is higher in a country than the Death Rate. What will happen to the population?
The population will increase because more babies are being born and less people are dying.
300
What type of population distribution is represented in this image?
Peripheral Population Distribution
300
What is represented in this image?

Population Density
300
Describe the population density in the photo.
Dense
400
Describe the birth rate and death rate from 1950 - 2017 using the information from the graph.
This demonstrates a positive growth rate! We can assume that this means the birth rate is higher than the death rate.
400
What type of population distribution do you see in Cavanagh, Ireland?
(Use Google Maps and "Satellite" view to take a look!)
Scattered Population Distribution
400
What is represented in this graph?
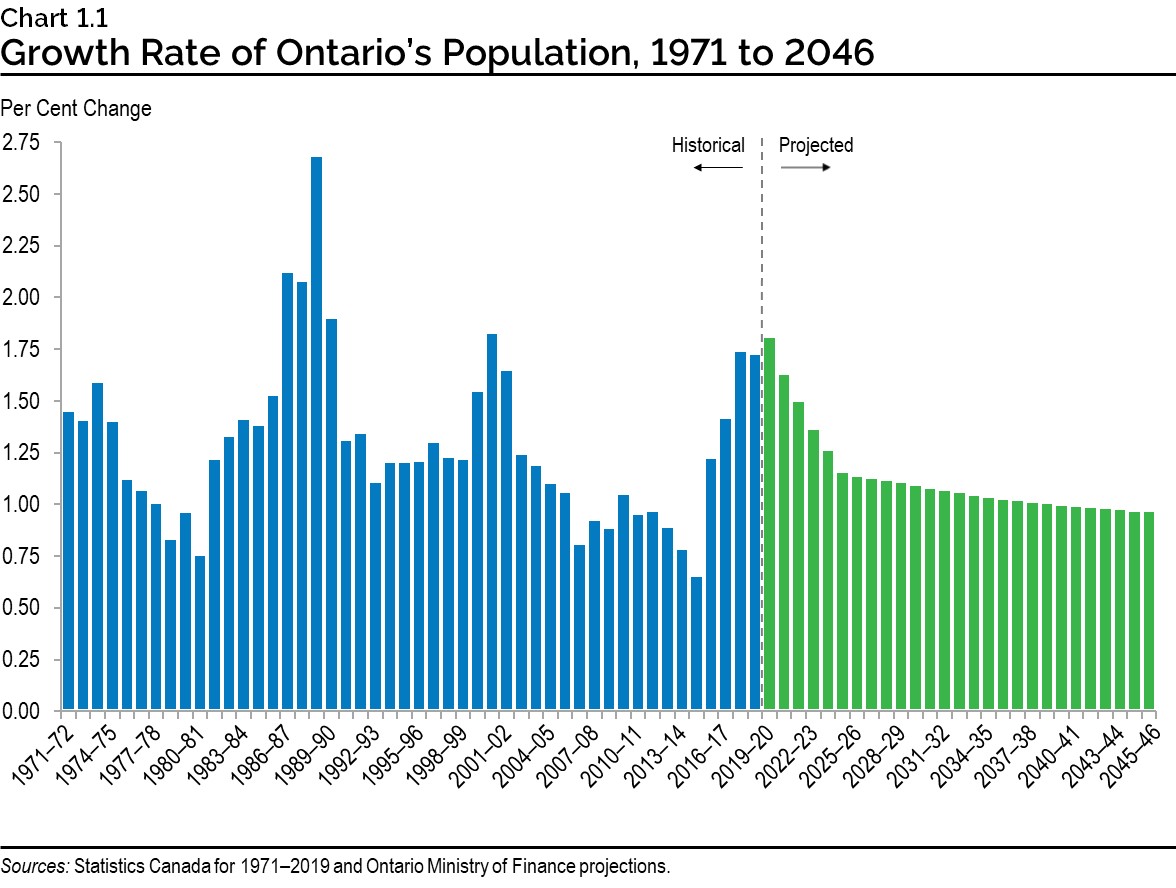
Population Growth Rate in Ontario
400
Describe the population density in the photo below.

Sparse
500
Describe the difference in population growth in 1950 to population growth in 2010 using the information on birth and death rates provided. 
In 1950, high birth rate, low death rate so there is a high growth rate and the population is growing rapidly.
In 2010, the birth rate and death rates are closer together. Birth rate is still higher so the overall population is still growing but much slower than in 1950.
500
What type of population distribution do you see in Mooretown, Ontario?
(Use Google Maps and "Satellite" view to take a look!)
Linear Population Distribution
500
What does this graph represent?
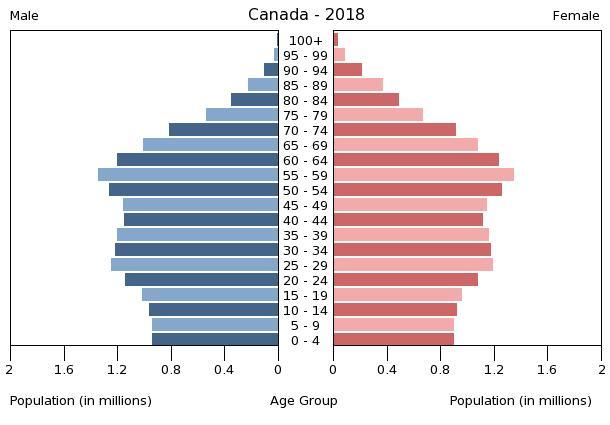
Canada's population in 2018 broken down into Age Group and Male/Female.
This is called a population pyramid!
500
What does "Carrying Capacity" mean?
Carrying capacity measures the maximum population that can survive without using up resources in the region.