Mean, Median, Mode
Box and Whisker Plots
Population & Sample
Line of best fit
Correlation
100
are mean, median and mode measures of central tendency or measures of spread?
Measures of central tendency
100

What is the median of this data set?
Median = 4
100
What is it called when data is collected from an entire population?
Census
100
Why is this line of best fit drawn incorrectly? 
It does not follow the trend (the points are a positive trend, the line is drawn negative)
100
What type of correlation is it when a pattern of data rises to the right?
positive
200
Find the median of the following data set
6, 8, 9, 12, 14, 15
10.5
200
What are the five components of a box plot?
Minimum, Lower quartile, median, upper quartile, maximum
200
Explain what the difference between population and sample is.
Population is the entire area of interest, sample is the area where data is being collected.
200
Why is this line of best fit drawn incorrectly?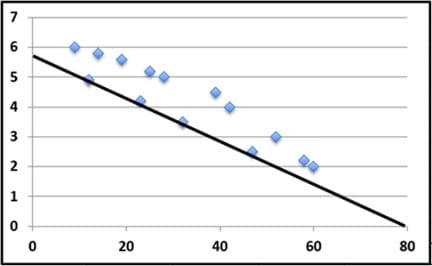
most of the points are above the line
200
describe the oval technique for determining strength of correlation
draw an oval tightly around data points, if it is skinny then it is a strong correlation, if it is fat then it is a weak correlation
300
Find the mode of the following data set:
4, 3, 7, 2, 3, 2, 4, 5, 4
4
300
What percentage of data falls between the minimum and the lower quartile?
25%
300
What is the population in the following scenario?
You survey 300 random students in a school to determine how many students in the school will attend the football game
Population = entire school
300
Explain the difference between interpolation and extrapolation
interpolation is making a prediction within the given data.
Extrapolation is making a prediction outside the given data.
300
What does a correlation coefficient tell you about a scatter plot and its trend?
The strength and direction (positive vs negative and weak vs strong)
400
find the mean of the following data set
6, 7, 6, 4, 3, 2
4.6
400
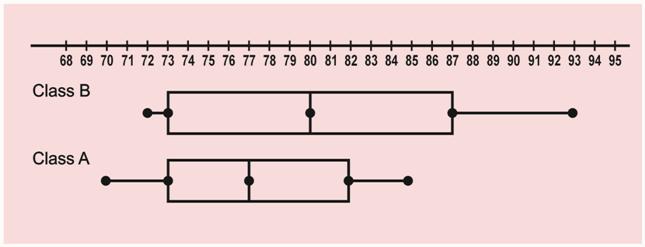
Which class has a bigger interquartile range?
Class B
400
Determine the population and sample in the following scenario
Sally is collecting data on which sports store in her town sells hockey sticks for the most money. She surveys 10 stores to find how much they sell a stick for.
Population: Sports stores in the town
Sample: 10 stores surveyed.
400
Which is more accurate extrapolation or interpolation
interpolation
400
what does a correlation coefficient of -1 tell us about the data?
It has a strong (perfect) negative trend.
500
Find the median of the following data set:
3, 7, 12, 4, 6, 3, 2
4
500
Explain how to find the lower and upper quartile
Take the median of the lower half of the data (excluding the median)
Take the median of the upper half of the data (excluding the median)
500
State whether the following scenario is one variable data or two variable data:
Jamie researches how many hours of hockey Canadians watch each week
One variable data
500
State the 3 rules for drawing a line of best fit
1. the line must follow the trend
2. there should be a similar number of points above and below the line
3. the line should pass through as many points as possible
500
Will this correlation have a correlation coefficient closest to -1, 0 or 1 ?
1