Gráfico de barras
Graficas con dibujos
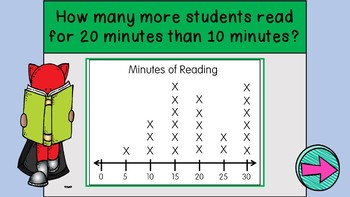
Leyendo el gráfico de barras
Graficas de dibujos y barras
100
¿Qué película gusta más?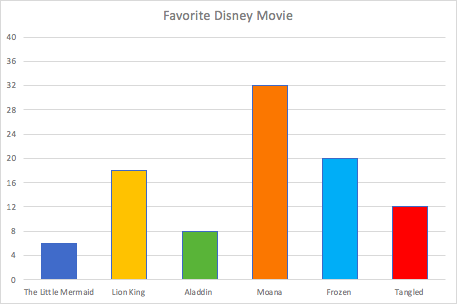
Moana
100
Which month had the most days at the beach?
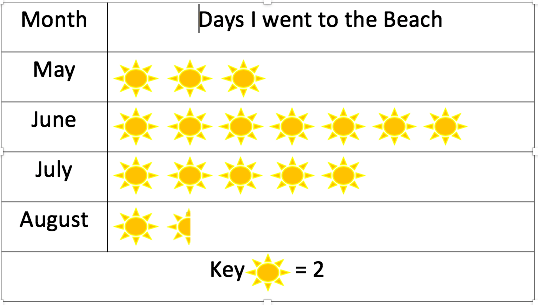
June
100
How many more votes did "Up" get than "Ice Age"
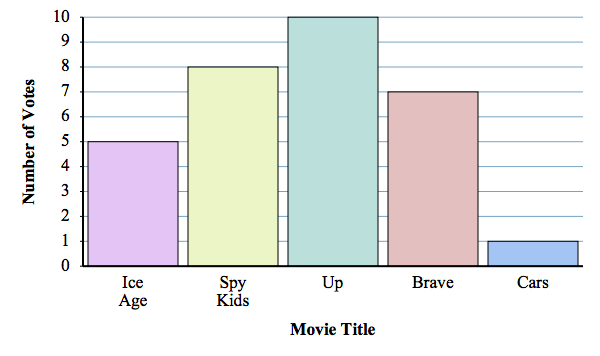
5
100
46
200
¿Qué película es la que menos gusta?
The Little Mermaid
200
Which month had the least?
August
200
How many fewer people voted for Cars than Spy Kids?
7
200
2
300
¿Cuál es la diferencia entre las personas que vieron Moana y las personas que vieron El Rey León?
14
300
How many days did I go to the beach in August and July?
13
300
Jamie made a bar graph to show different flavor ice cream cones sold at the community fair. What is the difference between the amount of cherry and bubble gum that was sold?
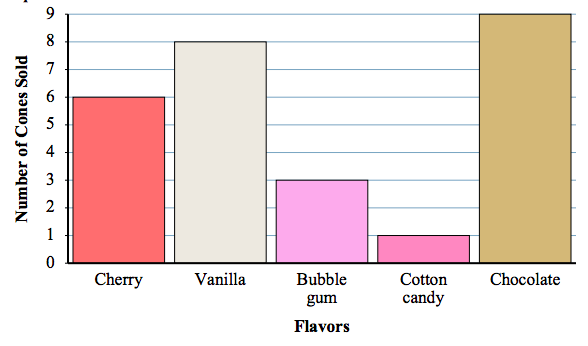
3
300
How many students liked purple? 
17
400
How many more people liked Frozen and Aladdin than those that liked The Little Mermaid?
22
400
How many times did I go to the beach in all?
33
400
How many fewer bubble gum cones were sold than cherry and vanilla combined?

11
400
How many books did the children read altogether?

66
500
How many people participated in the survey?
96
500
How many more times did I go to the beach in May and June than in July and August?
7
500
What flavor was the most popular?
chocolate
500
Each week, how much more does Maggie's Cafe spend on apples than Anna's Bakery?

60-40=20