20
How many people prefer comedy movies?
4

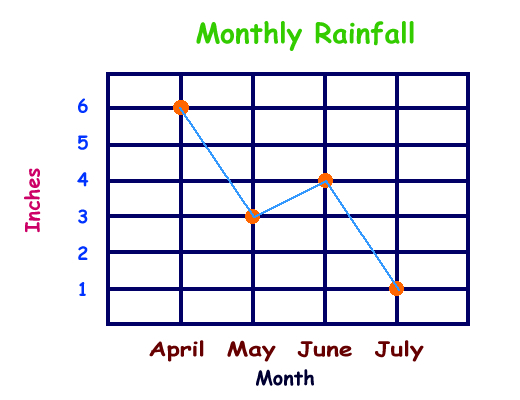
How many inches of rain fell in May?
3

8

How many pencils did Frank have?
9

3

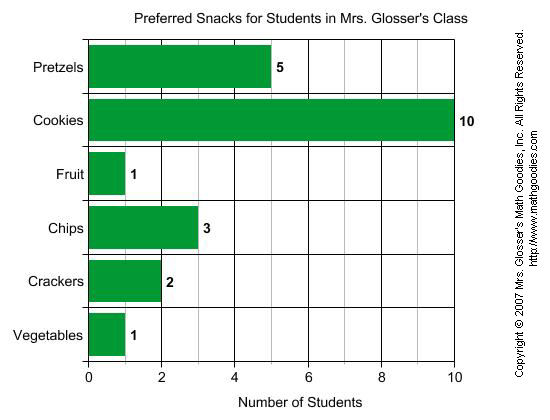
How many students voted for their favorite snack?
22

How many push-ups did this person do on Monday and Tuesday combined?
15

How many pieces of candy did Susie eat?
6

How many students had birthdays in the first and last months of the year?
13

25

How many more people prefer Life and Kix cereal than Corn Flakes?
5

What was the greatest distance Josh traveled from his home?
4 miles

How many students love hamsters more than dogs?
2
How many apples were sold in March and April combined?
25

How many students spent between 2 1/2 and 3 hours reading?
11
How many more people prefer blueberries than grapes?
35
![]()
Which week had the highest candy sales?
Week 6

How many more students ride their bike or the bus to school than walk?
8

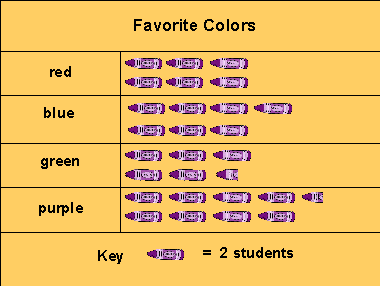
How many more students like purple than green?
6

1

How many people chose popcorn, cheese, or fruit as their favorite snack?
21

How many degrees did the temperature change from 5 a.m. to 11 a.m.?
20 degrees

How many days did Zane and Yvette make their beds in November?
35
 How many students voted in this class?


