Mixed Bag
Bar Graph
Picture Graph
Pie Graph
Mystery Category
100

Which was the least favorite sport?
Ice Hockey
100

How many students like baseball the best?
6 people
100
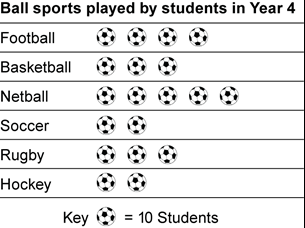
How many students play rugby and soccer?
50
100

What percent of people like PIZZA?
100%
100
What things must always be on a graph's axis?
Title
Labels on the Axes
200

What percentage of people liked grapes and bananas? Clue: add grapes + bananas
57%
200
How many total people completed the survey?
Clue: you must add the totals of all sports 9+7+5+2+6=
29 people
200
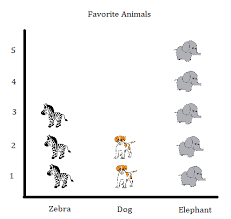
How many more elephants than dogs??
5 - 3 = 2
200

This circle graph represents a classroom of 20 students. How many students chose pepperoni pizza?
10 students
200
List 3 types of visual data displays (hint look at the back of the room)
Graph, Table, Pie chart, etc.
300
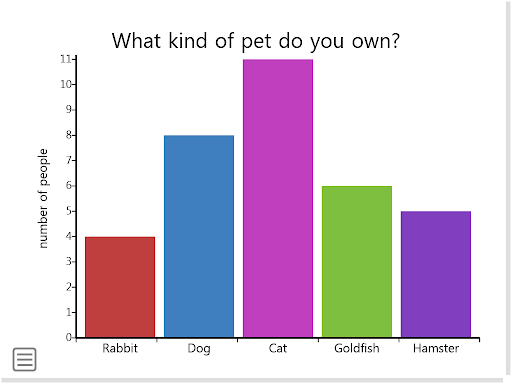
How many students own dogs?
8 students
300
How many more students like Soccer than Basketball?clue soccer minus basketball=answer
9 - 7 = 2 students
300
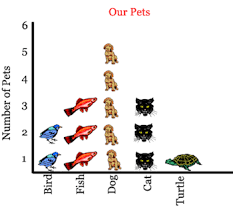
If each picture is worth 5 pets how many more people own dogs than turtles?
20
300
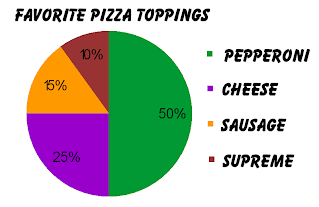
This circle graph represents a class of 20 people. How many people chose CHEESE pizza?
5 people
300
you usually use me to display data in percentages
I sometimes need to be converted to degrees
What type of graph am I?
Pie Chart
400
Free points!
everyone gets 400 points
400
What is the most favorite sport?
SOCCER
400
How many people like custard and original doughnuts?
What piece of information is unnecessary on this graph?
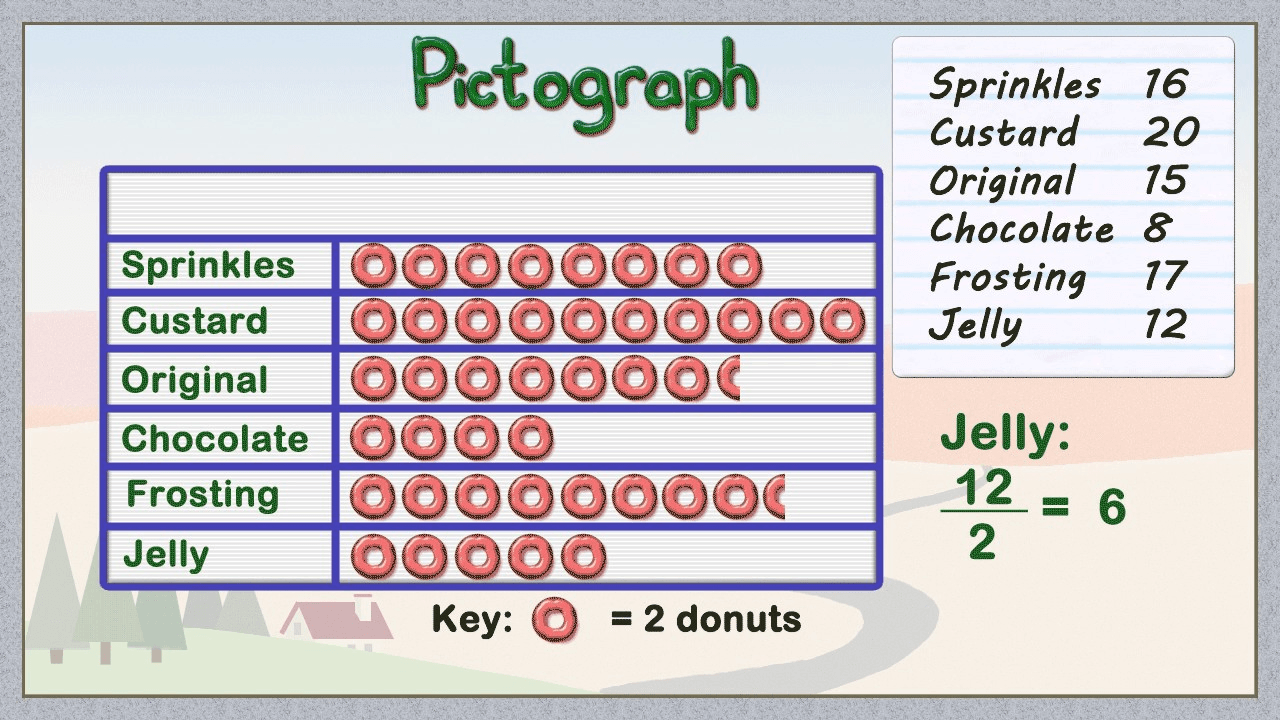
35 people
Jelly 12/2=6
400
 This circle graph represents 100 people. How many more people chose pepperoni compared to cheese?
50-25 = 25 students
400
At what points in time are the temperature the same?
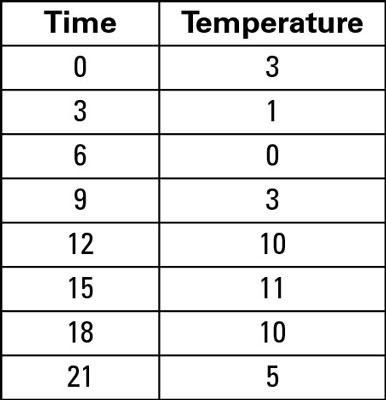
0 and 9, 12 and 18
500
Which colour had the biggest increase oveerall?
Which had the smallest increase between pre school and primary?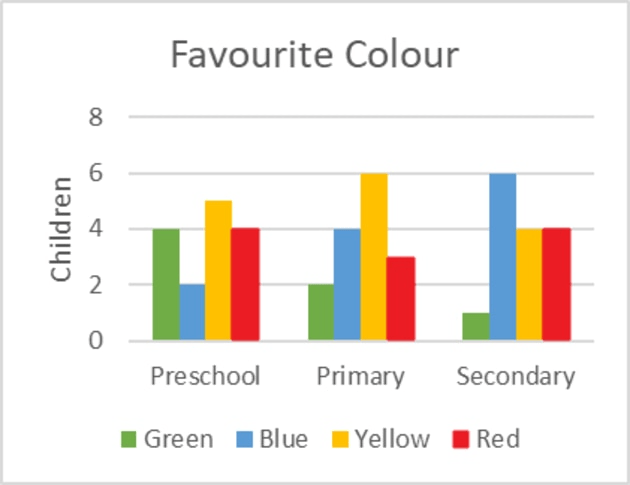
Blue
500
How many people picked a favorite sport that is played on a court?
12 people
Basketball and Tennis are played on courts, the others are played on fields or pitches
500
Sneaky Question!
Can you name the term most commonly used to describe the Y-axis
Vertical
500
 What percentage of people preferred meat based pizzas?
50 + 15 + 10 = 75%
500
create a graph to represent this data
Miss Josman to Judge