Types
Terms
Interpreting
Variables
Making Graphs
100
This type of graph is best used when showing the amount of things per category
Bar Graph
100
The name of a graphs horizontal axis
x-axis
100
Part of the world with the largest population? (2010)
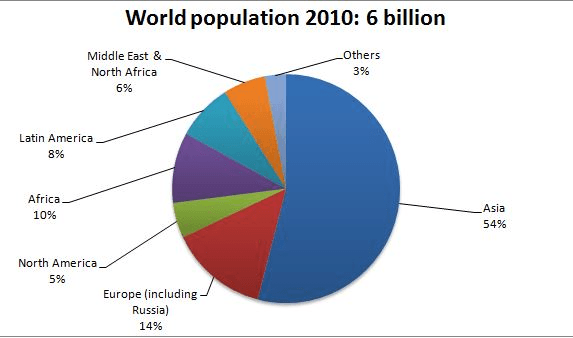
Asia
100
The independent variable
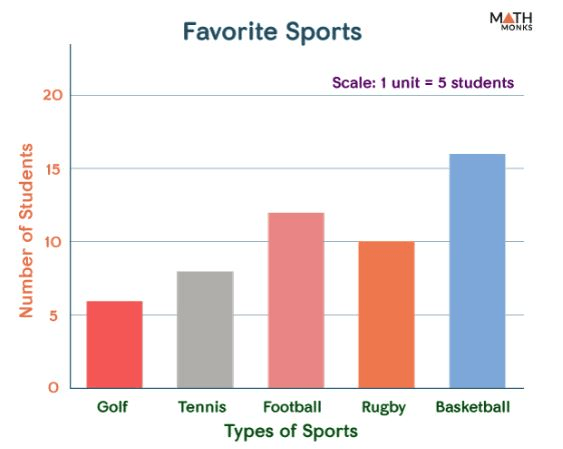
Type of sport
100
Every graph should start with this number
0
200
This type of graph is used to show trends over time
Line Graph
200
The name of the graphs vertical axis
y-axis
200
The most common score range? Two answers
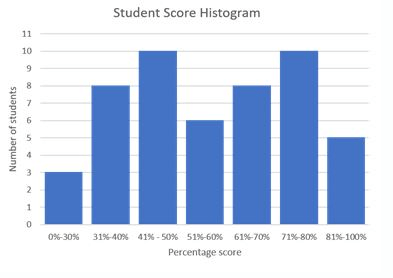
41-50% and 71-80%
200
The independent variable 
Type of animals
200
The variable that gets plotted on the x-axis
Independent Variable
300
This type of graph is used to display parts of a whole
Pie Chart
300
This graph feature shows the meaning of symbols or colors on a graph. It has two names
Key or Legend
300
The overall trend of this graph? Positive or negative?
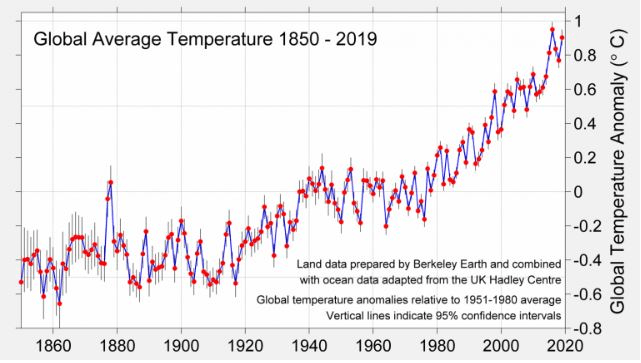
Positive
300
The dependent variable?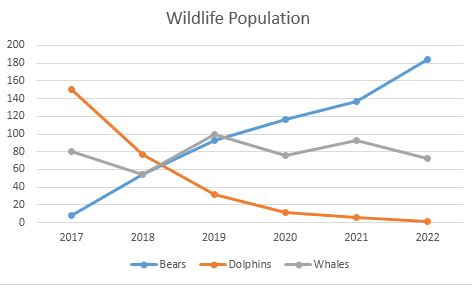
Population of animals
300
The variable that gets plotted on the y-axis
Dependent Variable
400
This type of graph shows a lot of data to try and see a pattern
Scatterplot
400
The term for where the x-axis and y-axis meet. Located at (0,0)
Origin
400
The month with the highest temperature

July
400
The dependent variable
Population
400
Every graph should have a good one of these. Like a book
Title
500
What do we use graphs for
To show a picture of data to understand and interpret it better
500
The name for a set of numbers that you plot on a graph
Coordinates or data
500
The month with the highest amount of rainfall
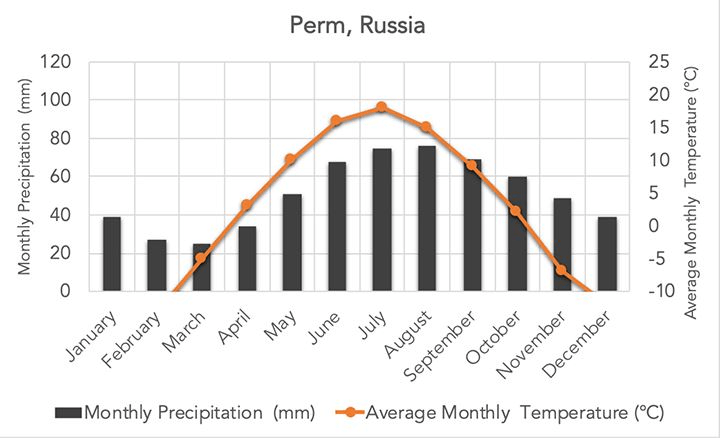
August
500
The independent variable
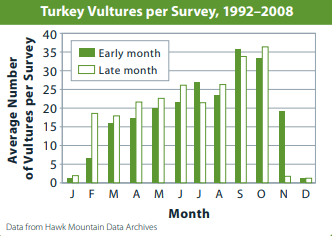
The time of month (early/late)
500
When performing an experiment, the information that gets plotted on your graph should come from this
Data Table