(IF you KNOW you KNOW)!

The title of this pictograph is...
What is Lemonade Stand Profits
 The temperature at 5:00 p.m. and 8:00 p.m.
What is 40 degrees
Which color has the greatest number of people who voted for it?
What is Blue
This graph would show how temperatures or patterns change over time.
What is a line graph
This part of a bar graph tells you what the survey is about.
What is the title
 How many people picked frosting and jelly as their favorite donut?
What is 29

What was the difference in temperature at 11:00am and 5:00pm?
20 degrees
 How many people voted for Life and Corn Flakes as their favorite types of cereal?
What is 10.
Use these graphs to track how many students like certain pizza toppings.
Bar Graphs and Pictographs
Use this graph to track the changes in weather and temperature.
What is a line graph
 Pictographs have a title, labels, and a key. The labels are describing what?
What are donut flavors
 How much warmer was the temperature at 11:00am than 8:00am?
What is 10 degrees warmer

Shannon was teaching her class about bar graphs and she told them that the numbers are counting by 2's. Those numbers are called THIS.
What is a scale
The difference between a pictograph and a bar graph is this.
What is the scale and the key
This part of a line or bar graph tells the amount that was surveyed.
What is scale

This many customers came to French's restaurant in 2010.
What is 6,000
A line graph shows data by using what
What is points and lines
The labels on this graph show THIS.
What is types of pizza toppings.

How many students ate 3 candy bars?
3
This word means to plan or map out and is used to create line graphs.
Plot
 In 2008, 1,500 customers came to French's restaurant. In 2009 4,000 people came to French's restaurant. How many more people came in 2009 than 2008?
What is 2,500
 At what times during the day was the temperature equal?
11:00am and 2:00pm AND 5:00am, 5:00pm, and 8:00pm

Jose scores five more runs than Tracy. How many runs did he score?
What is 17

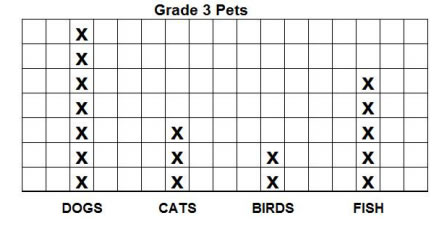
Assuming that each 'x' is 1, how many more students have dogs than cats?
What is 4
Sariya is collecting information to create a bar graph that shows how many kids under 13 have social media accounts. Information is another word for THIS.
What is data
